GBP USD resumes bearish momentum
GBP/USD (daily chart shown below) has resumed its bearish momentum below the 1.6300 level after having made a substantial rebound in the past several weeks […]
GBP/USD (daily chart shown below) has resumed its bearish momentum below the 1.6300 level after having made a substantial rebound in the past several weeks […]
GBP/USD (daily chart shown below) has resumed its bearish momentum below the 1.6300 level after having made a substantial rebound in the past several weeks up to the 1.6500 resistance level.
That 1.6500 resistance level was also around the 38% Fibonacci retracement of the currency pair’s recent bearish trend from the mid-July multi-year high of 1.7190, down to the 1.6050 low three weeks ago.
After the recent rebound to resistance, GBP/USD fell back down below the 1.6300 previous support level, tentatively re-asserting its bearish stance.
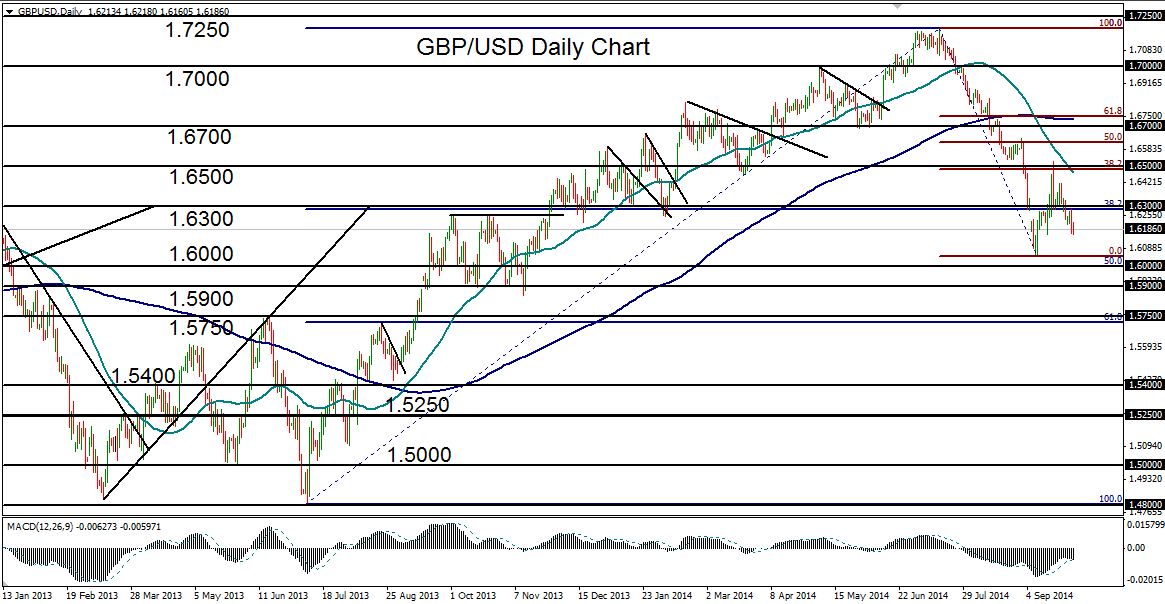
Lending to the overall bearish bias is the fact that the 50-day moving average crossed decisively below the 200-day moving average in early September, a major bearish technical event that has not occurred since February of 2013.
If the pair continues to trade below 1.6300 resistance, the directional bias should continue to be strongly to the downside. In this event, GBP/USD should once again target the 1.6000 psychological support level, which it came just short of hitting three weeks ago. Any break below 1.6000 should be followed further to the downside by the 1.5900 and then 1.5750 support targets.
