GBP USD rebounds from double bottom towards double top
GBP/USD (daily chart) has rebounded from a double bottom formation around the 1.5900 support level. This occurs within a month-long consolidation after the pair trended […]
GBP/USD (daily chart) has rebounded from a double bottom formation around the 1.5900 support level. This occurs within a month-long consolidation after the pair trended […]
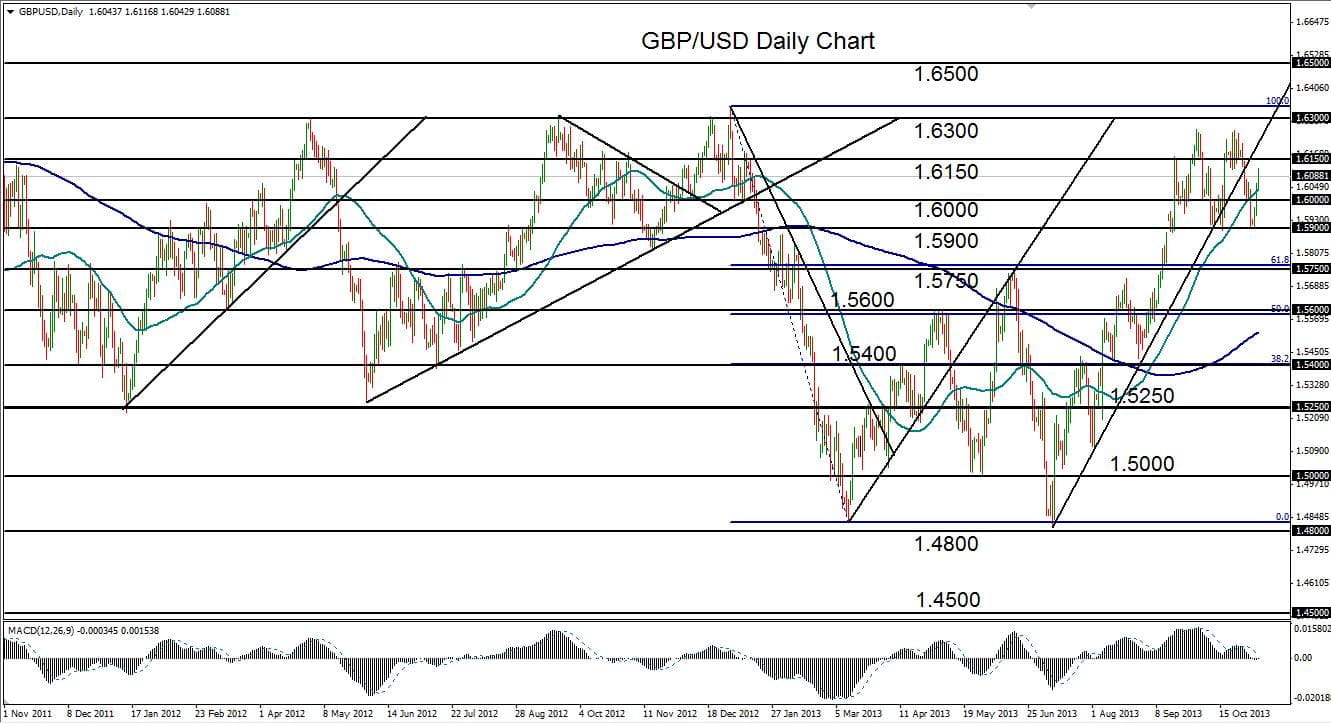
GBP/USD (daily chart) has rebounded from a double bottom formation around the 1.5900 support level. This occurs within a month-long consolidation after the pair trended up from July to hit a nine-month high at 1.6259 in early October.
After that high was reached, which was just short of major resistance at 1.6300, both a double top pattern and a double bottom pattern have formed within a well-defined trading range approximately between 1.5900 support and 1.6250 resistance.
Having just hammered out the double bottom around 1.5900 earlier this week, the pair has rebounded towards a potential re-test of the 1.6250 double top. Before it may potentially reach that level, the pair should bump up against intermediate resistance around 1.6150.
In the event of a breakout above both 1.6150 and the 1.6250 double top resistance, the price will have confirmed a continuation of the four-month uptrend and could then reach for further upside targets around the noted 1.6300 major resistance and then 1.6500.
Any breakdown below the 1.5900-area double bottom should find key support further to the downside around 1.5750.