GBP USD rebounds after pullback from new high
GBP/USD (daily chart shown below) has shown signs of rebounding after making a sharp, but relatively shallow pullback last week from its new four-year high […]
GBP/USD (daily chart shown below) has shown signs of rebounding after making a sharp, but relatively shallow pullback last week from its new four-year high […]
GBP/USD (daily chart shown below) has shown signs of rebounding after making a sharp, but relatively shallow pullback last week from its new four-year high of 1.6995. That high was just slightly short of its major upside target around the 1.7000 resistance level.
Last week’s pullback brought the currency pair down to a low around 1.6830 support, just above the significant high of 1.6821 that was hit in mid-February. This price action occurs within the context of a sharp bullish trend that has been in place for the past ten months – since the 1.4800-area low in July of 2013.
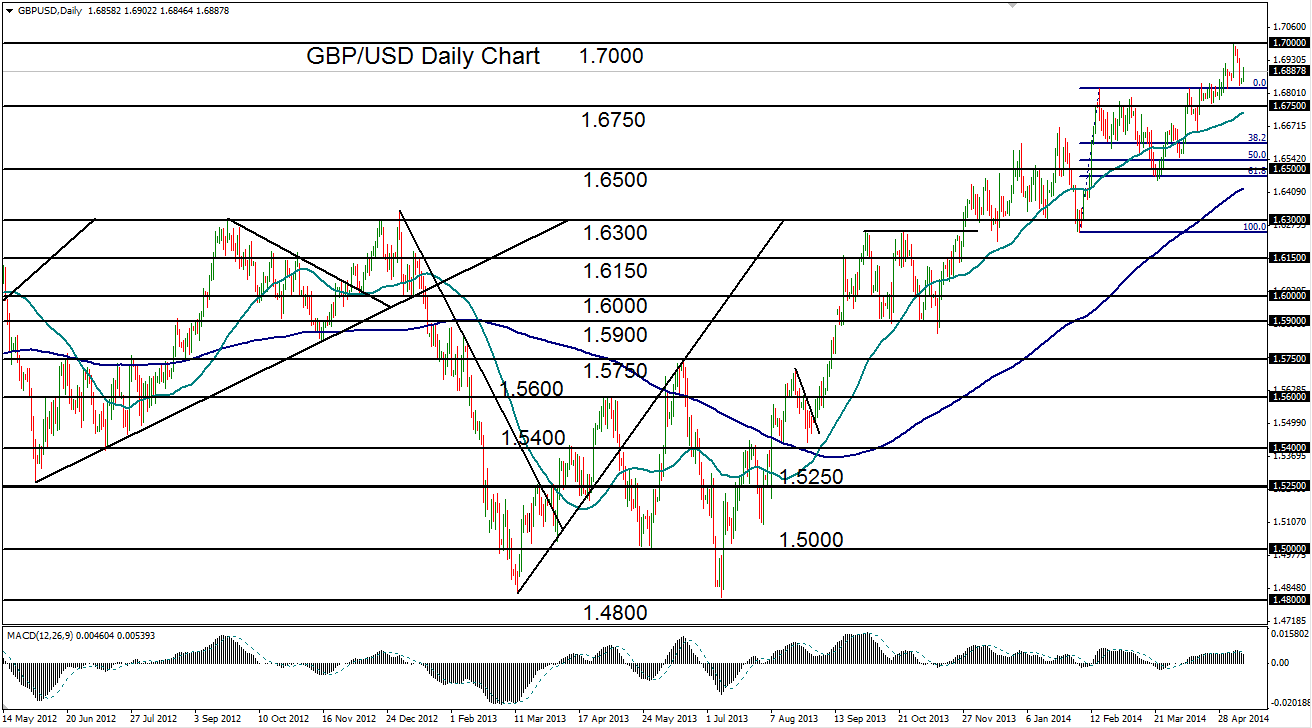
Still currently well above both its key 50-day and 200-day moving averages, GBP/USD’s sharp upward trajectory over the past year continues to exhibit the pound’s enduring strength against the dollar.
The short-term upside target remains at the 1.7000 psychological resistance level, with any further upside breakout potentially targeting the 1.7250 resistance area.
To the downside, near-term support on any further extension of the price pullback resides around the 1.6750 level and then the 50-day moving average.
