GBP USD Rebound and Recovery Threatened
GBP/USD (daily chart shown below) has pulled back to a key month-long trend line that represents the recent rebound and recovery from April’s multi-year low […]
GBP/USD (daily chart shown below) has pulled back to a key month-long trend line that represents the recent rebound and recovery from April’s multi-year low […]
GBP/USD (daily chart shown below) has pulled back to a key month-long trend line that represents the recent rebound and recovery from April’s multi-year low of 1.4565.
This partial recovery occurs after a sharp downtrend that saw the currency pair drop from a high of 1.7190 in July of last year to the noted April low of 1.4565, a decline of more than 15% within nine months.
The rebound from that low pushed GBP/USD up to hit a 2015 high of 1.5813 last week in mid-May, before pulling back down to 1.5500-area support on renewed US dollar strength.
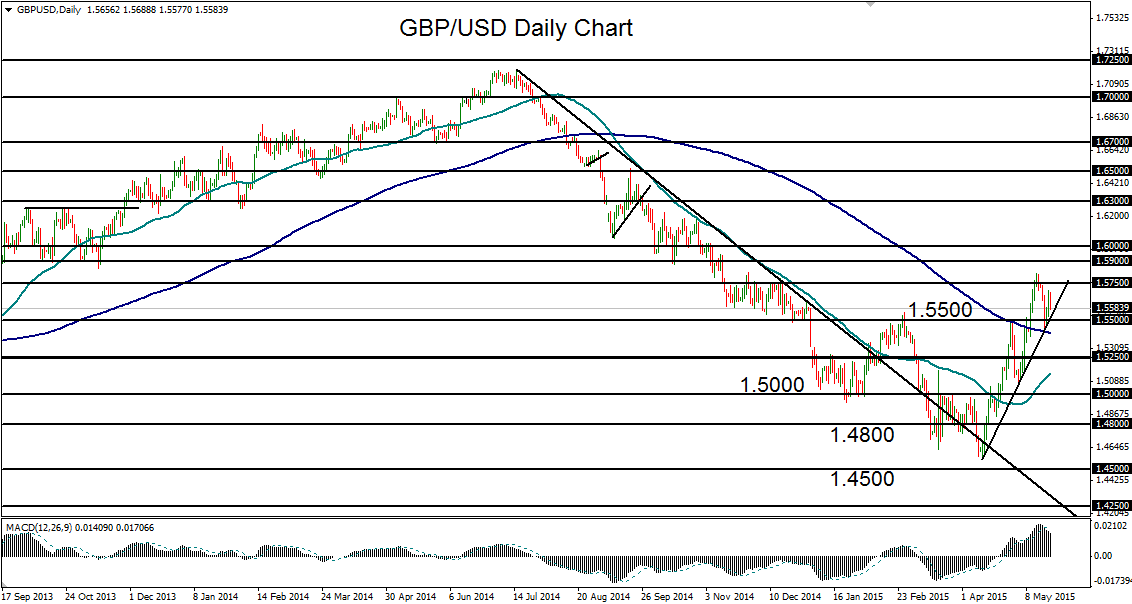
This resurgence in dollar strength continues to weigh down the currency pair, and has currently prompted a drop back down to the noted uptrend support line.
Any continued GBP/USD retreat threatens to break this trend line and potentially reverse the recovery that has been in place for more than a month.
A sustained break below the noted 1.5500 support area could lead to a reemergence of the entrenched downtrend and renewed bearish bias. In that event, the next major targets to the downside remain at the 1.5250 and then 1.5000 support levels.
