GBP USD reaches new long term high in steep climb
GBP/USD (daily chart shown below) has risen to establish a new four-year high at 1.6919 in early Thursday trading, confirming a continuation of the sharp […]
GBP/USD (daily chart shown below) has risen to establish a new four-year high at 1.6919 in early Thursday trading, confirming a continuation of the sharp […]
GBP/USD (daily chart shown below) has risen to establish a new four-year high at 1.6919 in early Thursday trading, confirming a continuation of the sharp bullish trend that has been in place for the past nine months since the 1.4800-area low in July of 2013.
This steep climb represents a full 14% advance in less than a year, highlighting sterling’s prominent strength in recent months.
The last major pullback within this robust uptrend occurred from late February to late March, when the currency pair made a 61.8% retracement of its last bullish run to a level just below 1.6500 support before making a strong rebound.
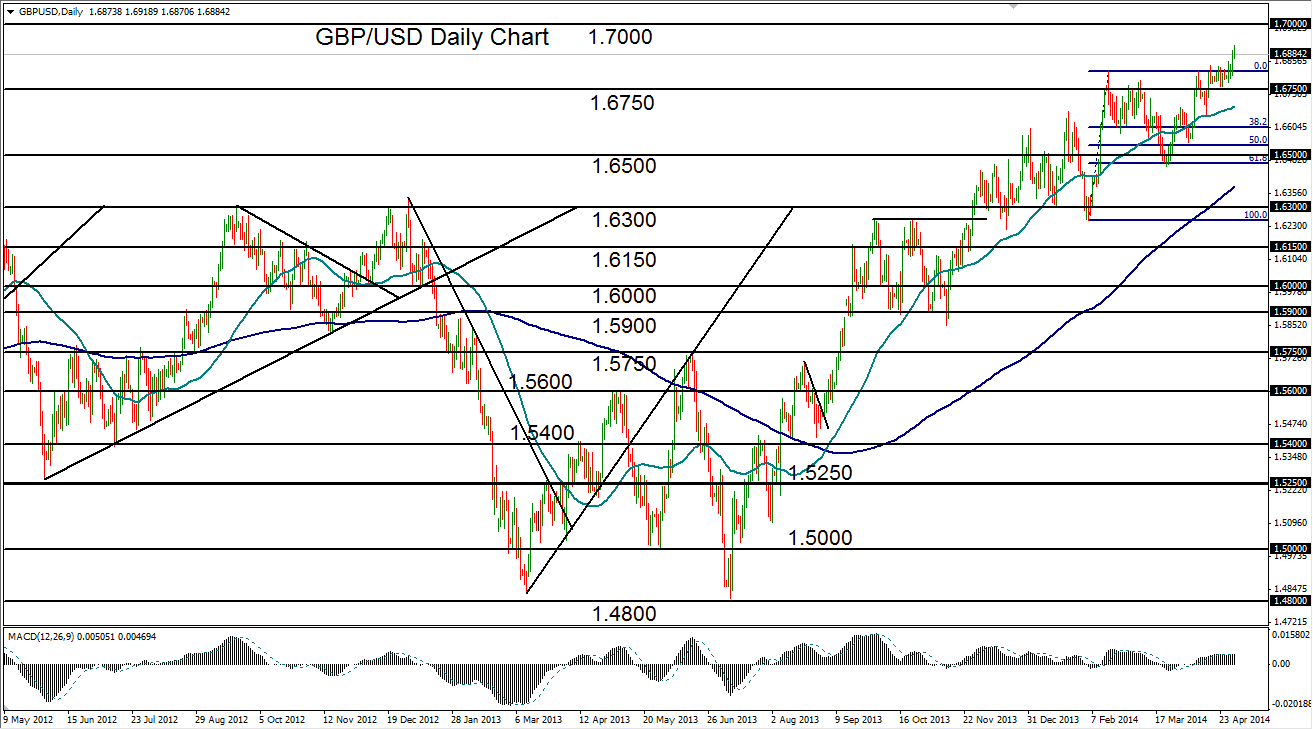
Currently well above both its key 50-day and 200-day moving averages, GBP/USD’s sharp trajectory has placed it in position for another pullback before a potential resumption of the entrenched bullish trend.
Shallow downside support on this potential pullback resides around the 1.6750 level and then the 50-day moving average.
To the upside, a continuation of the sharp uptrend should look next to target the nearby 1.7000 resistance level, where the currency pair last peaked in August of 2009.
