GBP USD pulls back within strong bullish trend
December 17, 2013 – GBP/USD (daily chart) has pulled back significantly after having hit a high of 1.6465 one week ago, just short of its […]
December 17, 2013 – GBP/USD (daily chart) has pulled back significantly after having hit a high of 1.6465 one week ago, just short of its […]
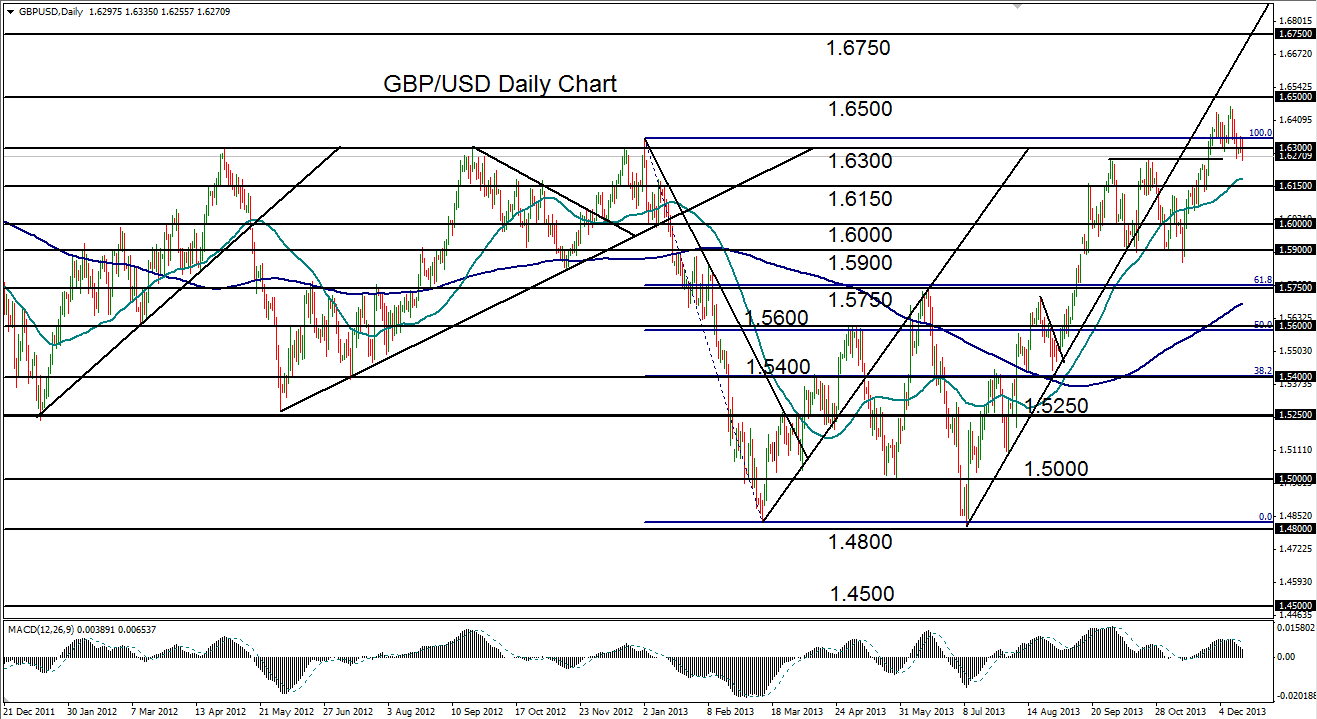
December 17, 2013 – GBP/USD (daily chart) has pulled back significantly after having hit a high of 1.6465 one week ago, just short of its 1.6500 upside target. Up to this point, that high has served as the culmination of a sharp bullish trend that has been in place since the July 1.4800-area low.
Looking at the year in review, GBP/USD displays a conspicuous ‘W-shaped’ pattern for the span of 2013. This pattern began high around major 1.6300 resistance, dropped swiftly to a low just above 1.4800 support in March, rose to an intermediate peak around the key 1.5750 level in June and dropped back down to the 1.4800 support area in July. It finally rose sharply for the remainder of the year to end up, as of mid-December, just under the 1.6300 area where it began.
Despite the current pullback, the technical outlook for GBP/USD continues to carry an overall bullish bias in line with the strong prevailing uptrend, and could potentially continue to reach for higher highs. The near-term upside resistance target continues to reside around the noted 1.6500 level.
Further to the upside, the key price objective to extend the bullish trend resides around the 1.6750 resistance level. Major downside support on a continued pullback resides around 1.6150 and then the 1.6000 psychological level.