GBP USD pulls back but maintains strong bullish trend
GBP/USD (daily chart shown below) has pulled back towards major support around the 1.7000 level but has, for the time being, maintained the strong bullish […]
GBP/USD (daily chart shown below) has pulled back towards major support around the 1.7000 level but has, for the time being, maintained the strong bullish […]
GBP/USD (daily chart shown below) has pulled back towards major support around the 1.7000 level but has, for the time being, maintained the strong bullish trend that has been in place for over a year since the July 2013 lows near 1.4800.
Price action is still trading well above its 50-day moving average, which continues to be sharply inclined and situated far above the 200-day moving average.
Having just reached a new multi-year high at 1.7190 last week, the currency pair has been due for a pullback to consolidate the steep gains it has made in the past few months.
The 1.7000 level to the downside is not only a key support/resistance and psychological level, it’s also around where the 50-day moving average currently resides, as well as the 38% Fibonacci retracement of the last bullish run from 1.6700 up to the noted 1.7190 high.
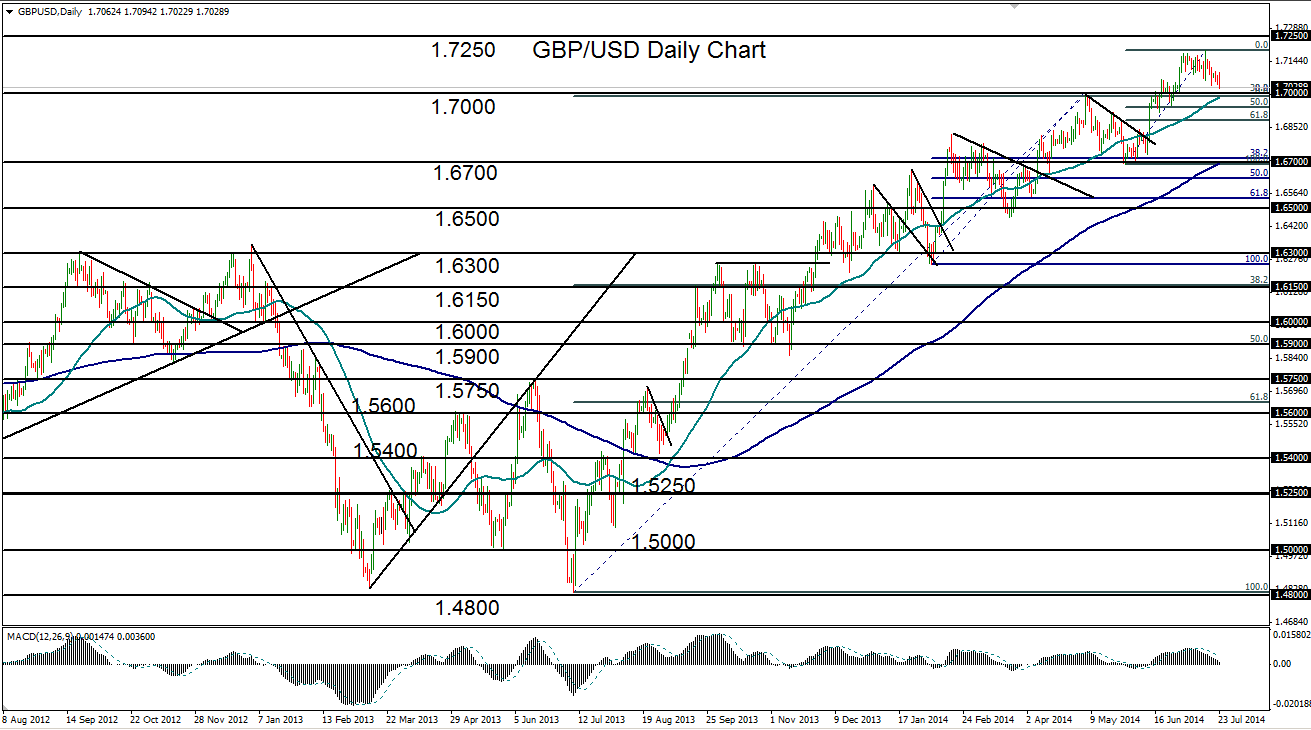
With the 1.7000 support level directly to the downside at the current time, GBP/USD is nearing a critical juncture. If the current pullback extends significantly below 1.7000, the currency pair could decline further towards major support around the noted 1.6700 level.
If, however, there is a turn back to the upside at or near the 1.7000 support level, the next major upside target resides around the 1.7250 level, which would confirm a continuation of the year-long bullish trend.
