GBP USD poised to break two month trading range
November 19, 2013 – GBP/USD (daily chart) has pulled back slightly from an intermediate resistance point around the 1.6150 price level. This occurs after the […]
November 19, 2013 – GBP/USD (daily chart) has pulled back slightly from an intermediate resistance point around the 1.6150 price level. This occurs after the […]
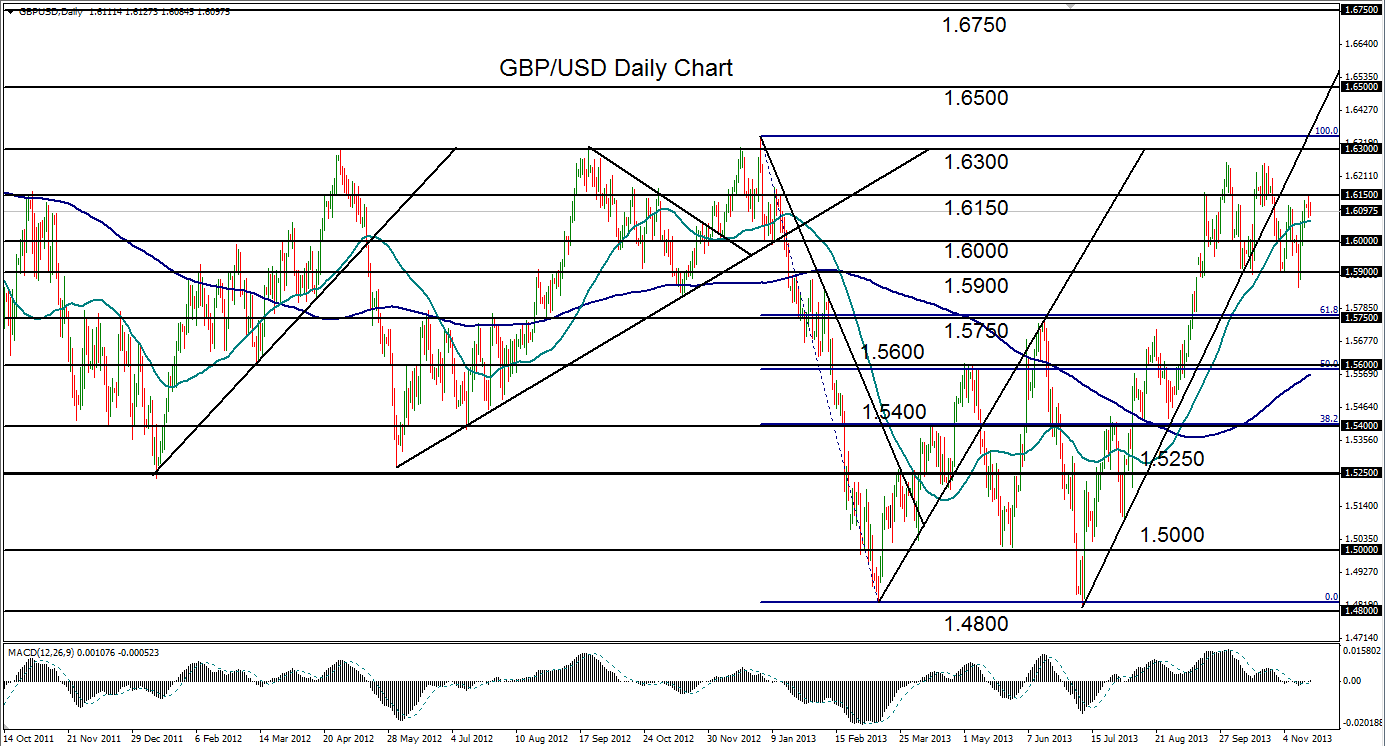
November 19, 2013 – GBP/USD (daily chart) has pulled back slightly from an intermediate resistance point around the 1.6150 price level.
This occurs after the pair rose sharply since midweek last week from just below the key 1.5900 support area. GBP/USD is still technically moving within a bullish trend, but the past two months have seen a clear sideways trading range, with two touches of 1.6250-area resistance to the upside and three approximate bounces off 1.5900-area support to the downside.
The ultimate direction of breakout from this trading range should determine the trend bias going forward. Last week’s false break below 1.5900 would have been considered a trend reversal off the 1.6250 double-top pattern, which would have then initially targeted the 1.5750 support level to the downside; but bearish price action failed to follow-through for the time being.
To the upside, the resistance barriers are clear and well-defined. Immediately above is the noted 1.6150 resistance level, followed further up by the 1.6250 double-top high, and then the major 1.6300 resistance level.
If the pair is able to clear all of those barriers and continue the bullish trend, a key upside target resides around 1.6500.