GBP USD Merely an oversold bounce
Things are looking decidedly better for risk assets today, and not just in a “Thank Goodness It’s Friday” kind of way. Starting with the world’s […]
Things are looking decidedly better for risk assets today, and not just in a “Thank Goodness It’s Friday” kind of way. Starting with the world’s […]
Things are looking decidedly better for risk assets today, and not just in a “Thank Goodness It’s Friday” kind of way. Starting with the world’s most important market of late, oil has built on yesterday’s gains and assuming the current gains hold, WTI is on track for back-to-back daily gains for the first time since before Christmas. As my colleague Fawad Razaqzada notes below, talk of a long-term bottom in oil prices is premature at this stage, but traders will take anything they can get after the relentless collapse to start the year.
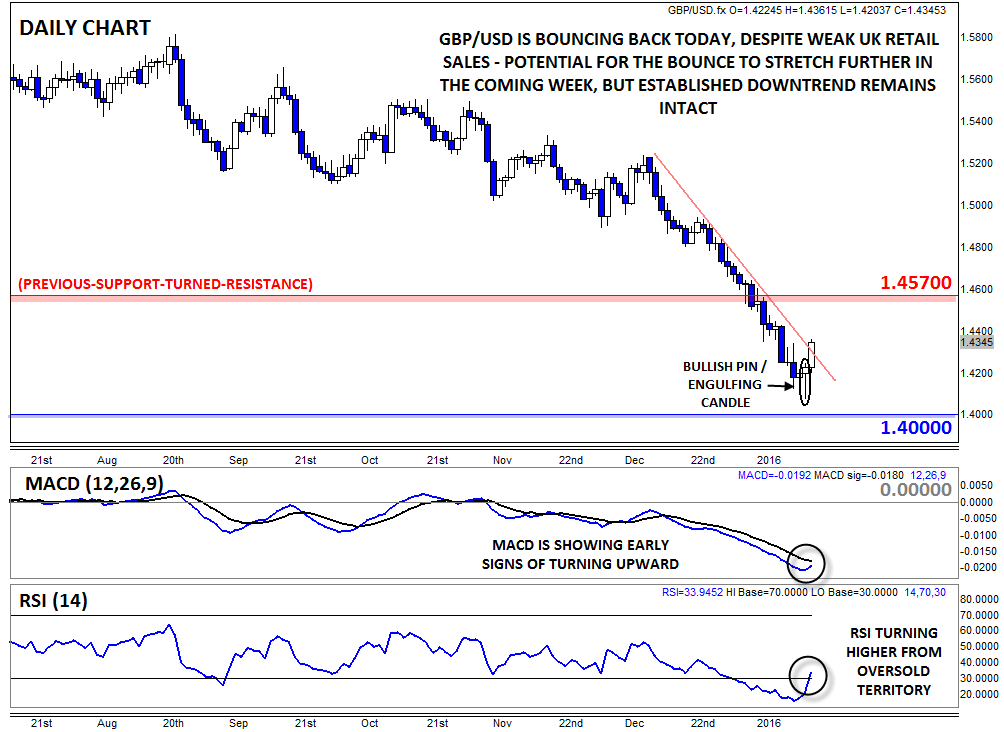
The greater optimism about oil is spilling over into other major asset classes, with global equities trading higher across the board and “risk” currencies rallying at the expense of safe havens like the Japanese yen. Like oil, one currency pair that’s long overdue for a bounce is GBP/USD, which tagged a fresh post-Great Financial Crisis low beneath 1.4100 yesterday. The unit has since surged over 250 pips to trade back in the mid-1.4300s, prompting traders to wonder whether we’ve seen a significant bottom in cable.
In our view, the answer is much the same as with oil: the current bounce could certainly extend into next week, but it’s still premature to call a meaningful low in GBP/USD. Supporting the bullish GBP/USD case, the daily chart shows a clear Bullish Pin* / Bullish Engulfing ** Candle formed on Thursday, signaling a big shift from selling to buying pressure. In addition, both the MACD and the RSI indicators are turning higher from subdued levels, suggesting that the bearish momentum is starting to shift, at least for the moment.
That said, the medium-term (and even the slightly-less-immediate-term) picture is still very worrying for sterling bulls. Even just today (Friday) we saw a disappointing UK Retail Sales report, showing sales declined on a month-over-month basis in the critical December holiday shopping period, and the November Retail Sales report was also revised down as well. Meanwhile, the pair is far from making any sort of higher high on the daily chart, so we’re inclined to give the established downtrend the benefit of the doubt for now.
* A Bullish Pin (Pinnochio) candle, also known as a hammer or paper umbrella, is formed when prices fall within the candle before buyers step in and push prices back up to close near the open. It suggests the potential for a bullish continuation if the high of the candle is broken.
**A Bullish Engulfing candle is formed when the candle breaks below the low of the previous time period before buyers step in and push rates up to close above the high of the previous time period. It indicates that the buyers have wrested control of the market from the sellers.