GBP USD maintains rebounds from lows
GBP/USD (daily chart shown below) has continued for the past month to maintain a rebound from its long-term low of 1.4950 that was hit in […]
GBP/USD (daily chart shown below) has continued for the past month to maintain a rebound from its long-term low of 1.4950 that was hit in […]
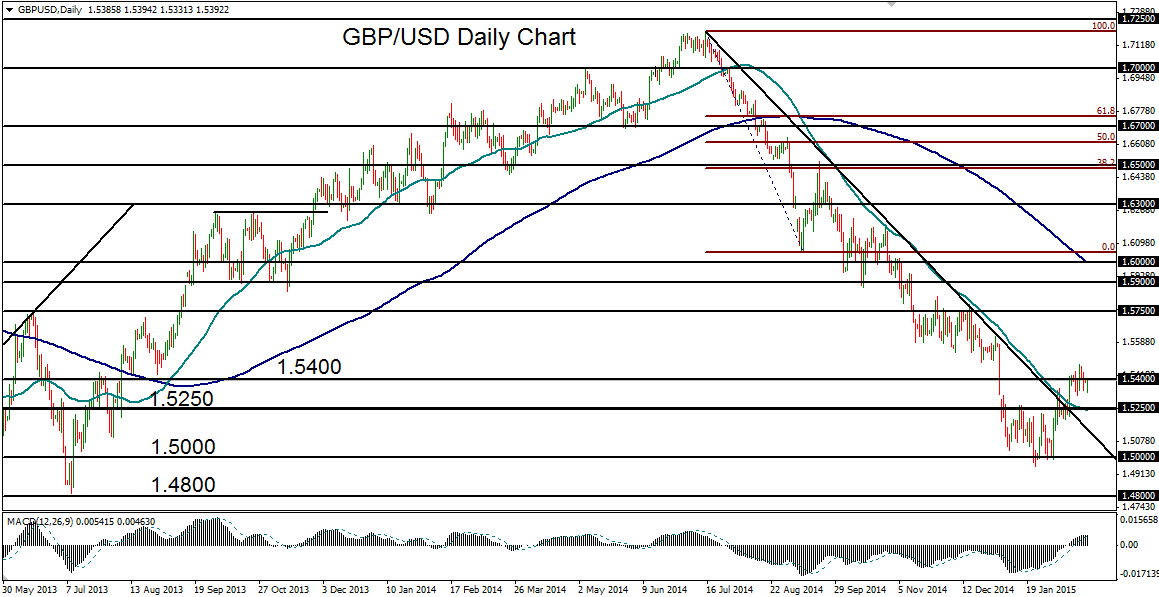
GBP/USD (daily chart shown below) has continued for the past month to maintain a rebound from its long-term low of 1.4950 that was hit in late January.
Since that low, which dipped slightly under key 1.5000 psychological support, the currency pair has risen in a marked rebound that has climbed above a key downtrend line extending back to the July 2014 high around 1.7190. In the process, GBP/USD has also crossed above its 50-day moving average for the first time in seven months.
Most recently, key resistance around the 1.5400 level was reached and marginally breached, after which the currency pair has begun to consolidate around this level.
In its rebound, GBP/USD has shown considerably more resilience than its EUR/USD counterpart.
Despite the rebound, GBP/USD is still weighed down by significant downside pressure. If the noted rise above 1.5400 is unable to be sustained, the currency pair should begin to retreat within the context of a bearish trend that continues to remain intact.
In the event of this retreat, downside targets continue to reside at 1.5250 and the noted 1.5000 psychological level. Any further bearishness that would continue the entrenched downtrend could then target the longer-term 1.4800 price objective.
