GBP USD maintains bearish trend bias
GBP/USD (daily chart shown below) continues to maintain an overall bearish trend bias despite last week’s spike. That rebound attempt was prompted by a swift, […]
GBP/USD (daily chart shown below) continues to maintain an overall bearish trend bias despite last week’s spike. That rebound attempt was prompted by a swift, […]
GBP/USD (daily chart shown below) continues to maintain an overall bearish trend bias despite last week’s spike. That rebound attempt was prompted by a swift, but short-lived, US dollar plunge that occurred after last week’s Fed meeting.
The spike hit a high of 1.5166, which was just under the 50-day moving average, before quickly retreating and entering into the current consolidation just above multi-year lows.
On the same day of the spike, a new four-year low of 1.4633 was established, which extended the sharp downtrend that has been in place for the past eight months since the July 2014 high of 1.7190.
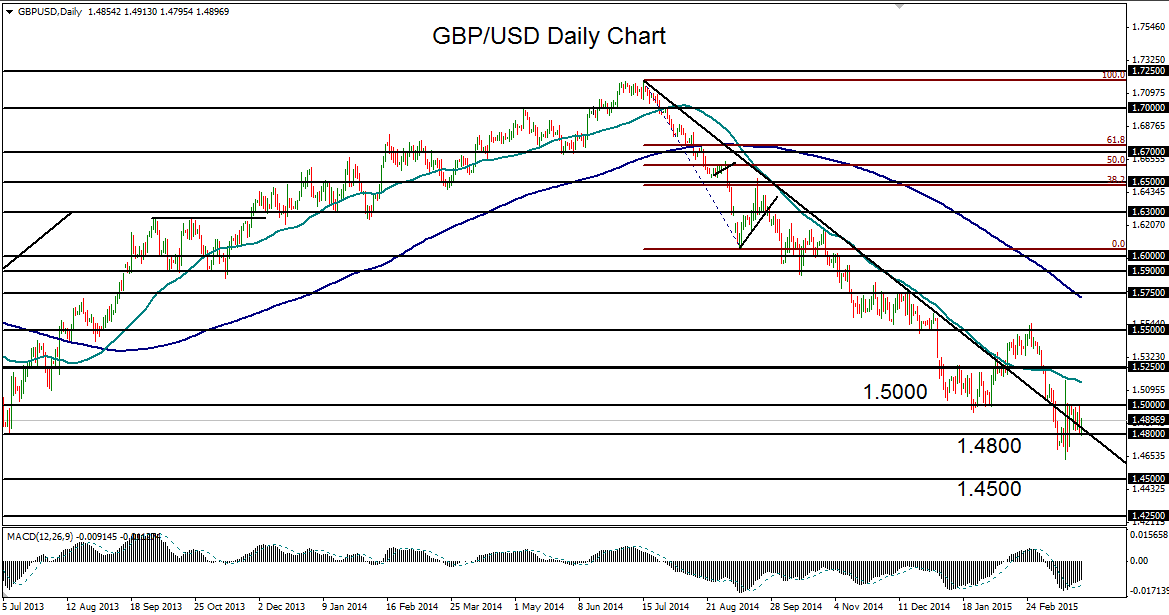
Currently range-trading between key 1.5000 resistance and 1.4800 support, the currency pair continues to be weighed down within the entrenched bearish trend.
Any re-break below 1.4800 support could pressure GBP/USD towards its next downside target around the 1.4500 support level.
Below the 1.4500 target lies a further downside objective at the pivotal 1.4250 support level, which was last hit in mid-2010.
