GBP USD hits one month high on rebound
GBP/USD (daily chart shown below) has hit a new one-month high above 1.5000 on a week-long rebound from multi-year lows. The currency pair has risen […]
GBP/USD (daily chart shown below) has hit a new one-month high above 1.5000 on a week-long rebound from multi-year lows. The currency pair has risen […]
GBP/USD (daily chart shown below) has hit a new one-month high above 1.5000 on a week-long rebound from multi-year lows.
The currency pair has risen sharply in the past week from its new four-year low of 1.4565 that was hit in mid-April up to its current position above both the 1.5000 resistance level and the 50-day moving average. Last week’s low was just short of reaching its 1.4500 support target.
Despite the fact that GBP/USD has been entrenched in a sharp downtrend for the past nine months since the July 2014 high of 1.7190, the current rebound has been especially acute.
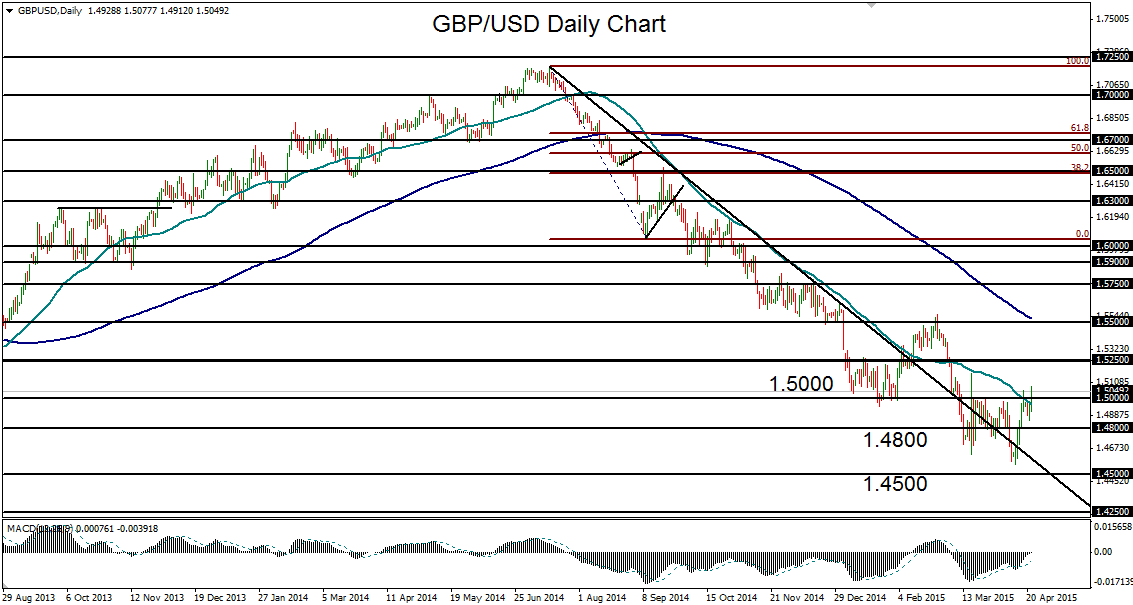
Any further rise and partial recovery of the embattled currency pair to continue the current rebound should meet major resistance around the key 1.5250 level.
To the downside, on a turn back down to resume the entrenched bearish trend, the next major downside target remains at the noted 1.4500 support level. Below this 1.4500 target lies a further bearish objective at the pivotal 1.4250 support level, which was last hit in mid-2010.
