GBP USD hits new multi year low
GBP/USD (daily chart shown below) hit a new multi-year low on Friday after breaking down below the previous four-year low of 1.4633 that was established […]
GBP/USD (daily chart shown below) hit a new multi-year low on Friday after breaking down below the previous four-year low of 1.4633 that was established […]
GBP/USD (daily chart shown below) hit a new multi-year low on Friday after breaking down below the previous four-year low of 1.4633 that was established just three weeks ago, in mid-March.
The new low confirms a continuation of the sharp downtrend that has been in place for the past nine months, since the July 2014 high of 1.7190.
Prior to the current breakdown, GBP/USD had been consolidating in a triangle pattern since the noted mid-March low.
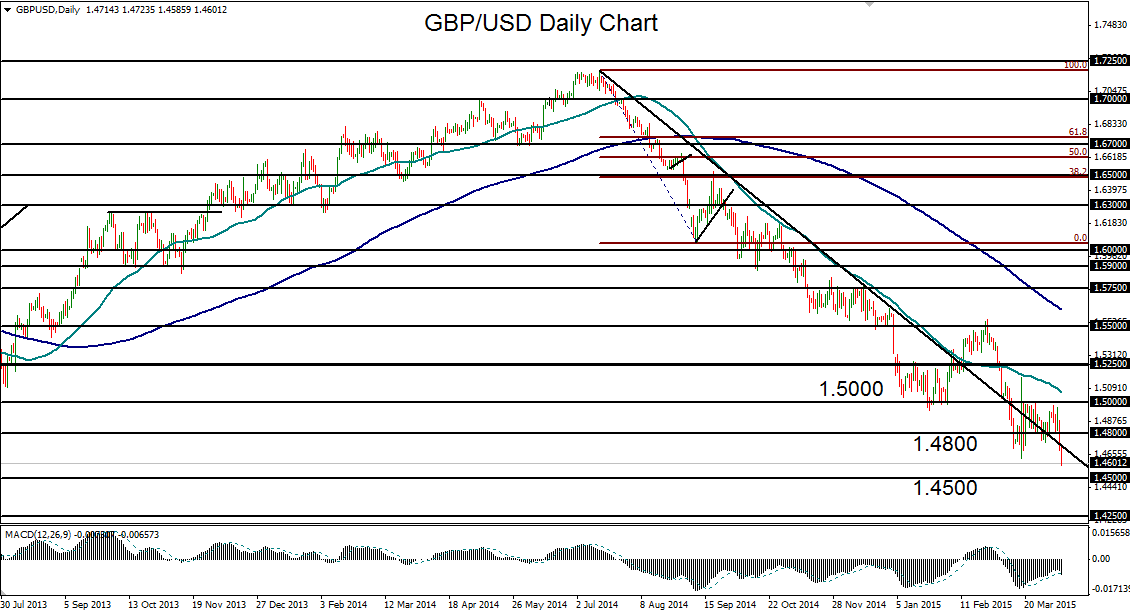
Having broken down decisively below that triangle consolidation, the currency pair continues to be weighed down heavily within the entrenched bearish trend.
The next major downside target remains at the 1.4500 support level. Below this 1.4500 target lies a further downside objective at the pivotal 1.4250 support level, which was last hit in mid-2010.
