GBP USD Heading and shouldering lower if 1 5175 breaks
After initially falling on last week’s seemingly-dovish Federal Reserve statement and press conference, the US dollar has been edging higher in mixed trade so far […]
After initially falling on last week’s seemingly-dovish Federal Reserve statement and press conference, the US dollar has been edging higher in mixed trade so far […]
After initially falling on last week’s seemingly-dovish Federal Reserve statement and press conference, the US dollar has been edging higher in mixed trade so far this week and based on this morning’s US economic data, the dollar could be poised for further gains today.
To kick things off, the weekly initial jobless claims report came out roughly in-line with expectations at 267k, remaining at a historically low level and showing that the labor market remains strong. At the same time, traders also got their first look at the higher-profile Durable Goods Orders report for August. This report, which measures purchases of goods that are expected to last for at least three years (including cars, appliances, furniture, etc.), declined by 2.0% m/m as expected. “Core” Durable Goods (excluding transportation) held steady at 0.0%, a slight miss relative to the expectations for a 0.2% gain, but far from concerning for a US economy that continues to hum along.
Technical View: GBP/USD
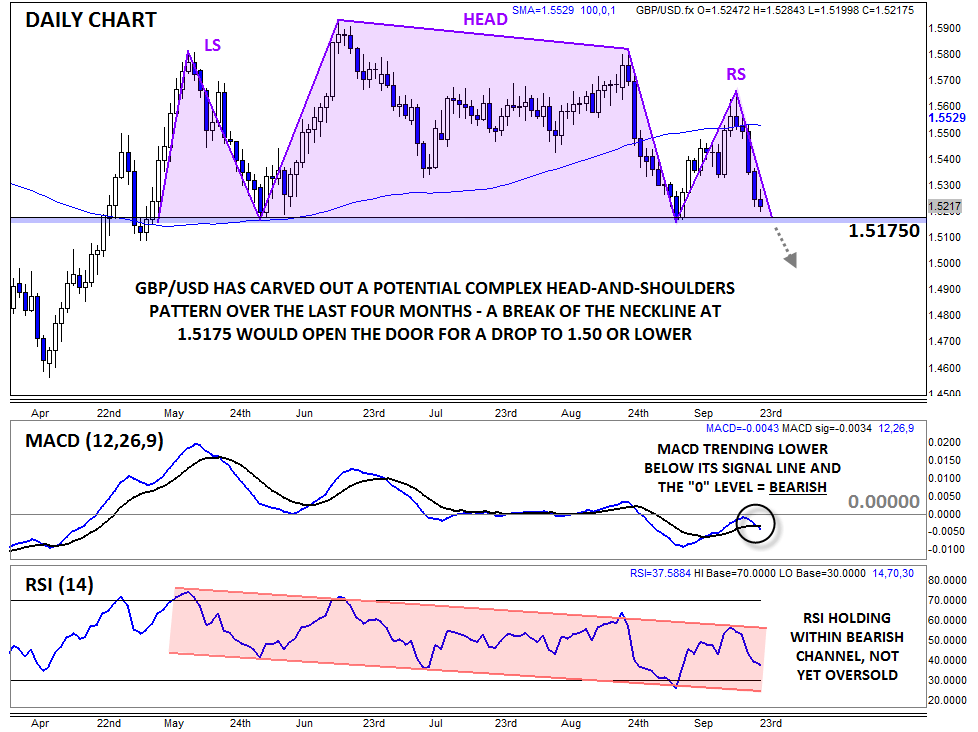
If you were long GBP/USD and have been away from your computer for the last week, you are not happy. After rallying briefly above 1.5650 last Thursday, the pair has fallen for five straight days (including today) to trade all the way down to the 1.5200 level as of writing. More concerningly, the pair has formed a complex Head-and-Shoulders pattern over the last four months. For the uninitiated, this classic price action pattern shows a shift from an uptrend (higher highs and higher lows) to a downtrend (lower lows and lower highs) and is typically seen at major tops in the chart.
It’s worth noting that the head-and-shoulders pattern is not confirmed unless/until GBP/USD breaks below the neckline at 1.5175, but the secondary indicators suggest that could happen sooner rather than later. The MACD is rolling over to trend lower below both its signal line and the “0” level, while the RSI indicator remains within a bearish channel and is not yet oversold.
If 1.5175 support gives way at some point in the next week, bears may quickly push the unit down toward key psychological support at 1.5000. In fact, the measured move objective of the pattern suggests GBP/USD could retest the year-to-date low near 1.4600 in time, though plenty would have to happen before that becomes a reasonable expectation. In order to shift from a bearish bias, traders need to see GBP/USD bounce support at 1.5175 and regain the 100-day MA at 1.5525 at a minimum.
 Source: City Index