GBP USD has the Cable stretched too far
Today has been all about the European stock markets which have closed sharply higher on hopes for a Greek deal this week. The FX markets […]
Today has been all about the European stock markets which have closed sharply higher on hopes for a Greek deal this week. The FX markets […]
Today has been all about the European stock markets which have closed sharply higher on hopes for a Greek deal this week. The FX markets have been far less volatile, although the dollar has gained some ground on the back of some decent US economic data, namely the latest existing home sales which climbed by a good 5.1% in May to an annualised rate of 5.35 million. It was better than the 5.27 million expected and also higher than the upwardly revised reading of 5.09 million for April. Though the dollar isn’t exactly on a tear, it is showing strength against most currencies, except the euro which is underpinned by the Greek news. But it is the GBP/USD which is catching our attention today.
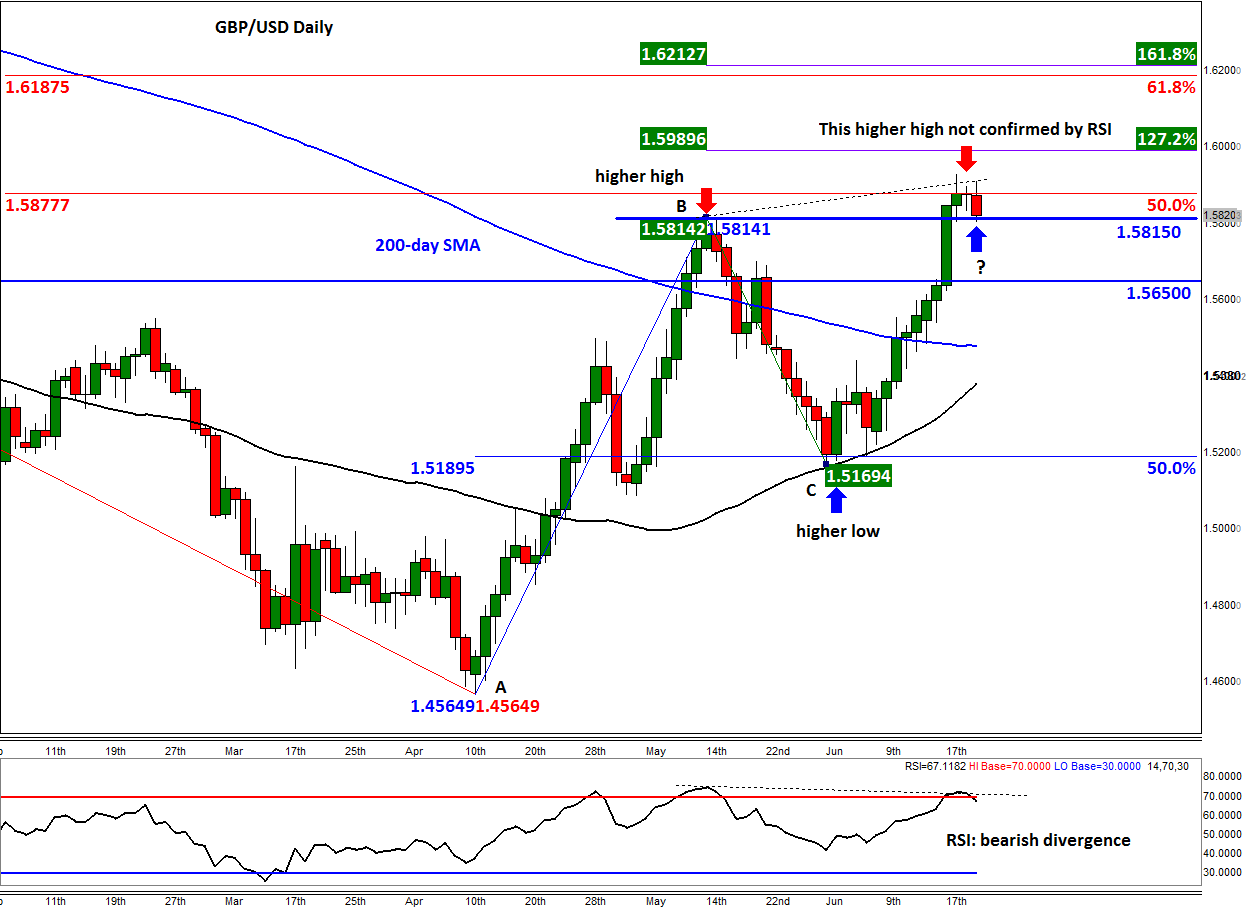
As can be seen on the chart, the Cable has created a couple of higher lows and higher highs in recent times. In other words, the trend has been bullish. Indeed, up until Friday, it had staged a nine-day rally and since bottoming out at 1.5170 at the start of the month, it has gained some 750 pips, no less. But such strength is difficult to sustain, particularly as the US Federal Reserve still likely to be the first major central bank to hike interest rates. Unsurprisingly, the momentum indicator RSI has already reached the overbought territory of above 70. In fact, the RSI has created a bearish divergence, forming a lower high relative to last week’s higher high in the underlying GBP/USD price action. This divergence points to a potential pullback of some sort in the GBP/USD.
At the time of this writing, the GBP/USD was testing the key 1.5815 level, which was previously resistance and corresponds with the high point in May. So, there is a chance it may now turn into support. However, if this level does not turn into support and price closes below here then a potential drop to at least the next support at 1.5650 could be likely. It is interesting to note that the GBP/USD’s hesitation here has come after it reached the 50% retracement level of the downswing from the 2014 high. If the recent move up from the 50% retracement level of the upswing from April is anything to go by, we may see a more significant sell-off in the coming days.
However, as mentioned, the price action is still clearly bullish. So, in the likely event that price holds above the 1.5815 support level, we may well see a continuation to much-higher levels this week. The next bullish targets are the Fibonacci levels shown on the chart at 1.5990 (127.2% extension of the BC swing), 1.6185/90 (61.8% retracement of the downswing from the 2014 high) and 1.6210/5 (161.8% extension of the BC swing).