GBP USD drops to dip below key support
GBP/USD (daily chart) has dropped to dip below major support around the 1.6500 price level, re-testing the sub-1.6500 lows hit in late March. In the […]
GBP/USD (daily chart) has dropped to dip below major support around the 1.6500 price level, re-testing the sub-1.6500 lows hit in late March. In the […]
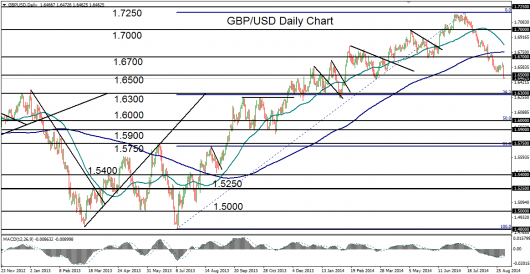
GBP/USD (daily chart) has dropped to dip below major support around the 1.6500 price level, re-testing the sub-1.6500 lows hit in late March. In the process, the currency pair has hit a new five-month low and could very soon be on its way to hitting a six-month low.
After a slight rebound during the prior week, Tuesday’s price action saw a sharp drop that pushed GBP/USD below its August low of 1.6534, and then tentatively below the noted 1.6500 psychological support level.
This bearish momentum occurs within the context of a newly-established bearish trend that originates from the mid-July multi-year high of 1.7190. From that high, the currency pair has plunged below several major support levels, including 1.7000, 1.6700, and now 1.6500.
In the process, price action has declined well below both the 50-day and 200-day moving averages. The 50-day moving average is now pointing sharply to the downside and could soon be converging with the lower 200-day moving average.
If GBP/USD continues to trade below 1.6500, the next major downside target clearly resides around the 1.6300 level, which is not only a major support/resistance area, but is also around the 38% Fibonacci retracement of the one-year bullish trend from the July 2013 low around 1.4800 up to the noted multi-year high of 1.7190 in July of this year.