GBP USD declines towards new 2014 low
GBP/USD (daily chart shown below) declined sharply after Wednesday’s Bank of England quarterly inflation report, and is once again closely approaching the new 2014-low of […]
GBP/USD (daily chart shown below) declined sharply after Wednesday’s Bank of England quarterly inflation report, and is once again closely approaching the new 2014-low of […]
GBP/USD (daily chart shown below) declined sharply after Wednesday’s Bank of England quarterly inflation report, and is once again closely approaching the new 2014-low of 1.5788 that was established just late last week.
GBP/USD has clearly been entrenched in a steep bearish trend for the past four months, since the multi-year high of 1.7190 was reached in mid-July.
This bearish trend has been outlined by both a well-defined downtrend line as well as the 50-day moving average. Late October saw an attempt at an upside breach of both this trend line and moving average, but price action quickly retreated to establish new lows.
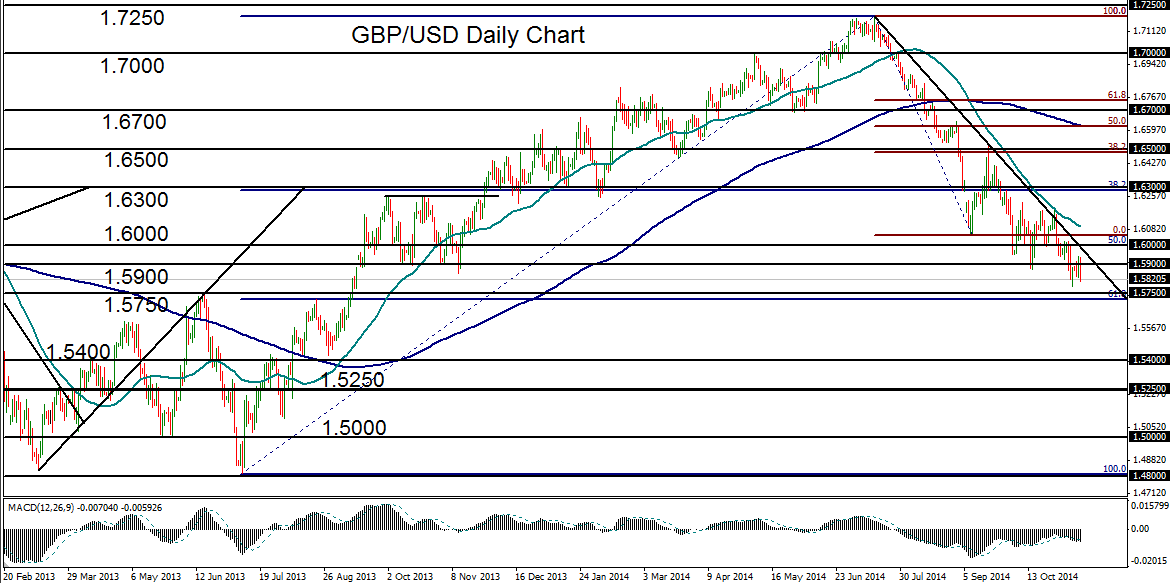
Currently, the currency pair is trading just slightly above last week’s noted year-to-date low, and continues to trade under pressure with a strongly bearish directional bias.
The next major support target immediately to the downside resides around the 1.5750 level, which is also near the 61.8% Fibonacci retracement level of the year-long uptrend from July of 2013 to July of 2014.
Any significant breakdown below 1.5750 would confirm a continuation of the entrenched downtrend, with further downside targets residing around 1.5600 and then 1.5400.
