GBP USD continues tumble towards 1 52
GBP/USD (daily chart shown below) has continued to plunge for the second consecutive day this week as the currency pair follows through on a sharp […]
GBP/USD (daily chart shown below) has continued to plunge for the second consecutive day this week as the currency pair follows through on a sharp […]
GBP/USD (daily chart shown below) has continued to plunge for the second consecutive day this week as the currency pair follows through on a sharp downtrend that has been in place for the past two weeks.
This short-term bearish trend has already dropped down to hit and break below its 50-day moving average, the key 1.5500 support target, as well as an uptrend line extending back to the 1.4565 multi-year low in mid-April. Currently, GBP/USD has tumbled even further to trade just slightly above its 200-day moving average.
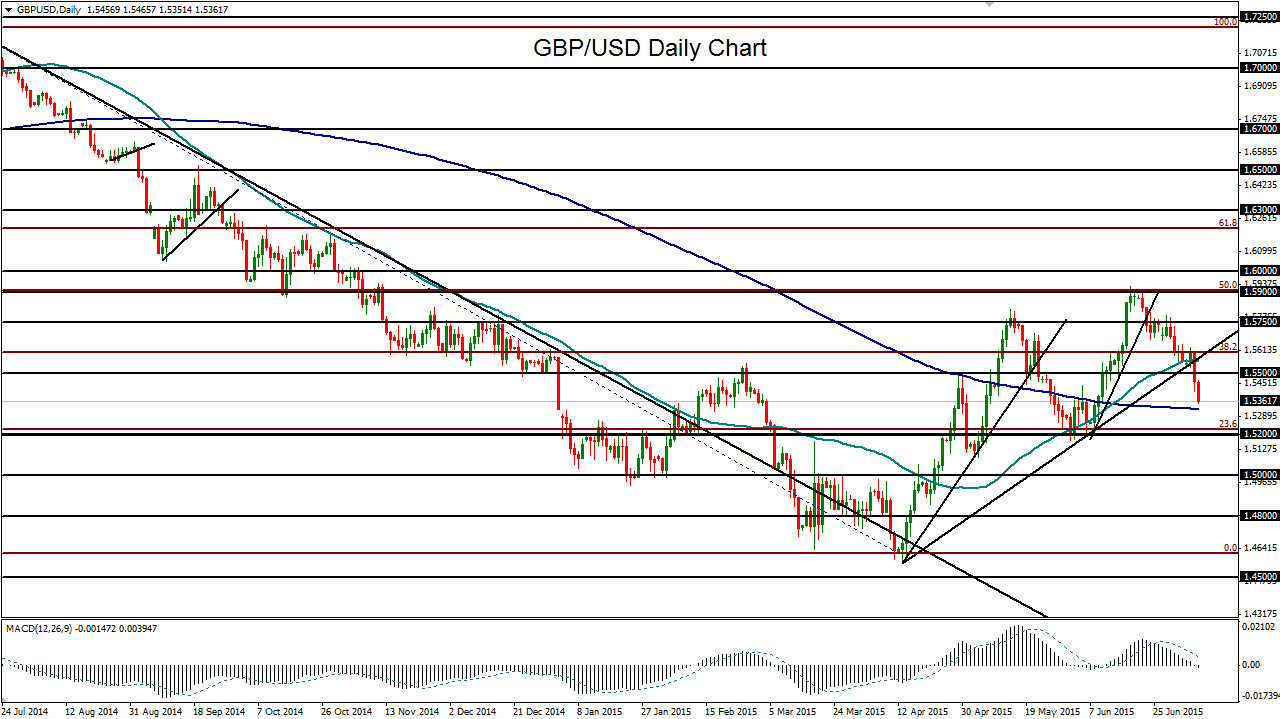
While the currency pair has been a solid performer in recent months, price action in the past two weeks has been decidedly negative, mimicking the sharp pullback in the latter half of May. The current decline from June’s 1.5928 year-to-date high now threatens to give back most of the considerable gains made during the middle part of June.
With both the longer-term and short-term trends pointing to the downside, the currency pair could have further to fall on the current bearish momentum and US dollar strength.
In this event, after yesterday’s breakdown below 1.5500, the next major downside target is around the 1.5200 level, where GBP/USD bottomed out in early June. In the event of further downside on any sustained break below 1.5200 support, the next clear target resides at the 1.5000 psychological support level.
