GBP USD Continues Slide from 2015 Highs
June 24, 2015 – GBP/USD (daily chart shown below) has continued to retreat for the third consecutive day from its new year-to-date high of 1.5928 […]
June 24, 2015 – GBP/USD (daily chart shown below) has continued to retreat for the third consecutive day from its new year-to-date high of 1.5928 […]
June 24, 2015 – GBP/USD (daily chart shown below) has continued to retreat for the third consecutive day from its new year-to-date high of 1.5928 that was reached last week.
That high was the culmination of a steep rise in the prior week that had over-extended the currency pair after having reached up to retrace 50% of the previous downtrend which ran from the 1.7190 high in July of last year down to April’s multi-year low of 1.4565.
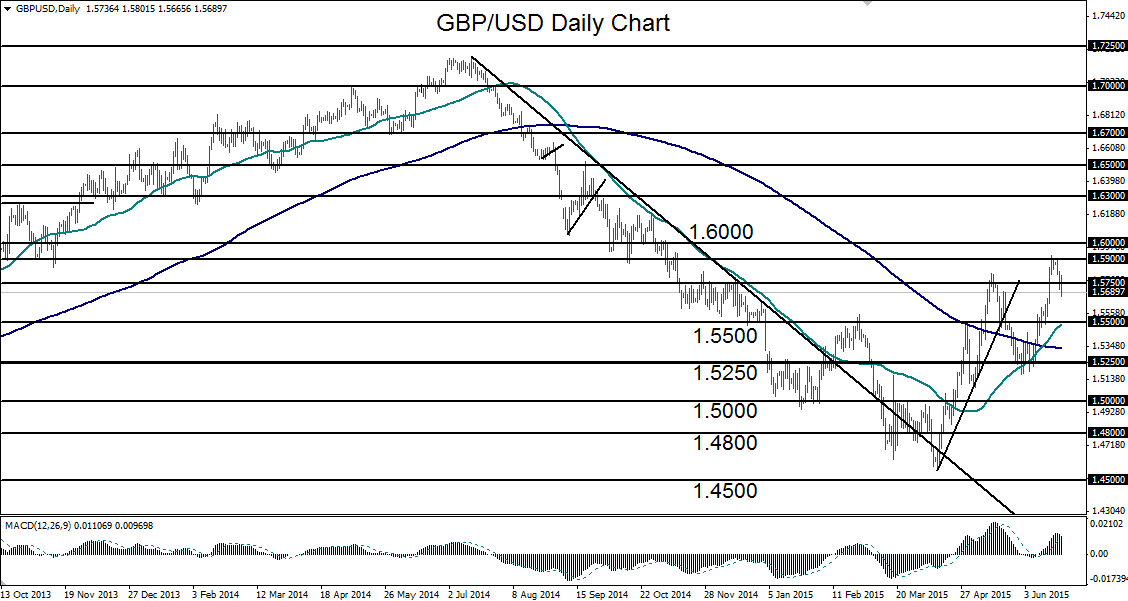
The rise and partial recovery from April’s low after that downtrend prompted a pivotal cross of the 50-day moving average above the 200-day moving average for the first time since the beginning of a bullish trend in late 2013.
Despite this potentially bullish technical signal, the sharp run-up from early May had pushed the currency pair into overbought territory, and a pullback had been due.
This pullback could see a further extension back down towards the major 1.5500 support level, where the 50-day moving average is also currently situated.
