GBP USD continues freefall into 2015
GBP/USD (daily chart shown below) has continued its freefall into the New Year as the currency pair hit a new 17-month low below 1.5100 on […]
GBP/USD (daily chart shown below) has continued its freefall into the New Year as the currency pair hit a new 17-month low below 1.5100 on […]
GBP/USD (daily chart shown below) has continued its freefall into the New Year as the currency pair hit a new 17-month low below 1.5100 on Wednesday.
Already in a sharp bearish trend from the 1.7190 high in mid-July of last year, GBP/USD kicked off 2015 with a dramatic plunge that broke down swiftly below the 1.5400 and then 1.5250 support levels.
Since the noted 1.7190 high in the third quarter of 2014, the currency pair has dropped by more than 12% in less than six months. While this plummet has not quite reached the magnitude of EUR/USD’s fall during the same time period, it has been a strong and consistent decline.
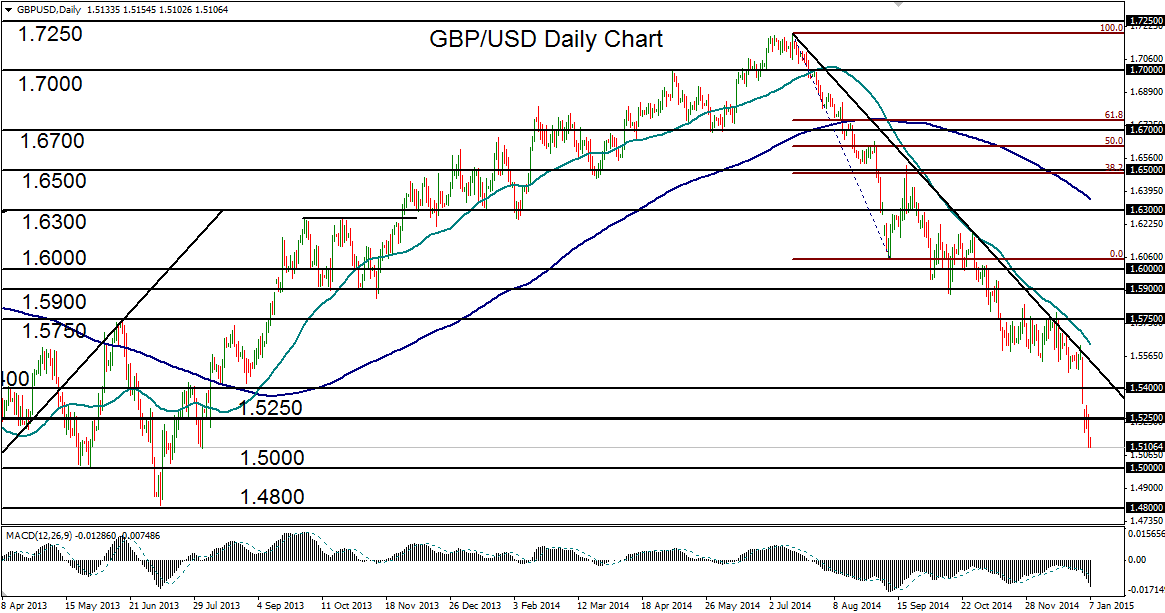
The US dollar strength that prevailed towards the latter part of 2014 and has resumed into 2015 continues to exert bearish pressure on GBP/USD. While the downside move for the currency pair has currently been over-extended, the trend continues to push towards lower lows.
With upside resistance on any pullback tentatively residing around the broken 1.5250 level, the next major support targets for this downtrend reside around 1.5000 and then 1.4800.
