GBP USD Continues Bearish Trend Towards 1 5000
GBP/USD (daily chart) as of February 19, 2013, having established a new seven-month low yesterday, has sustained the strong bearish trend that has been in […]
GBP/USD (daily chart) as of February 19, 2013, having established a new seven-month low yesterday, has sustained the strong bearish trend that has been in […]
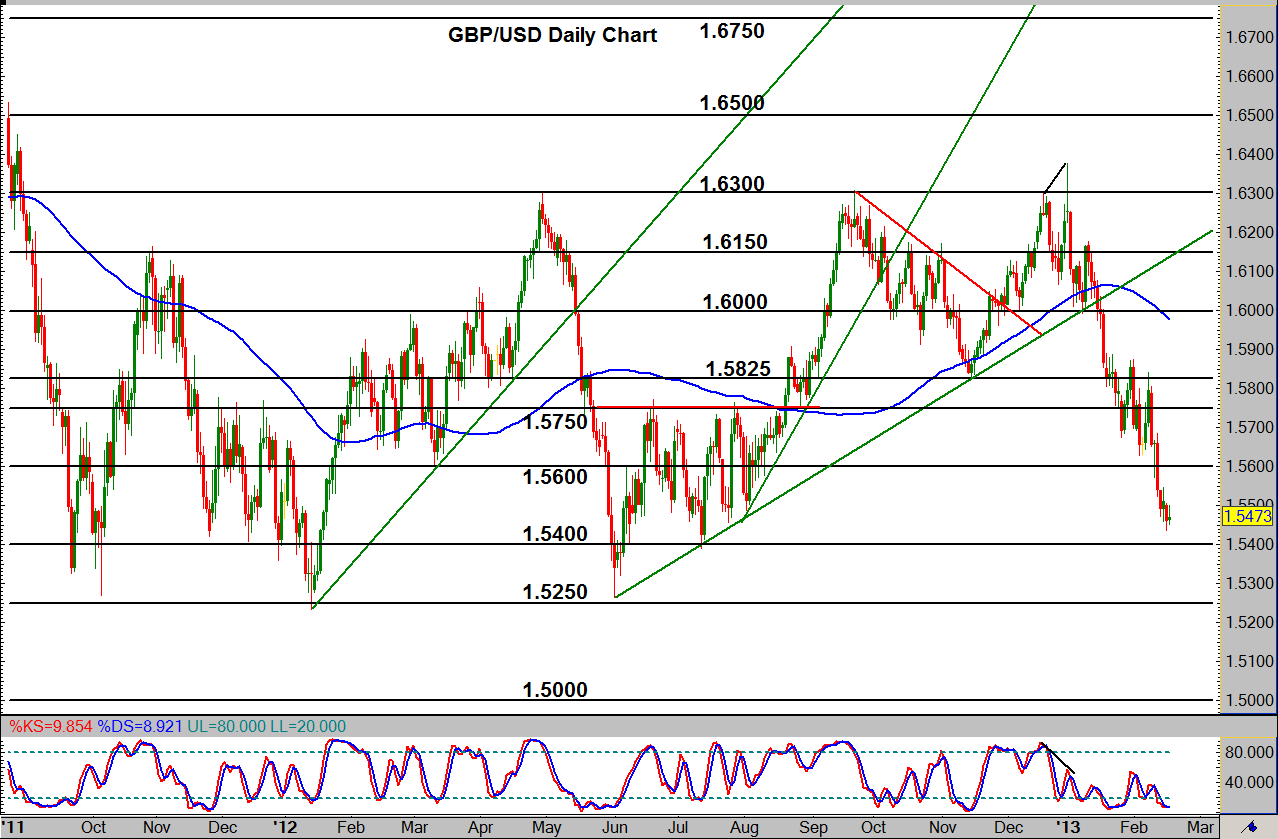
GBP/USD (daily chart) as of February 19, 2013, having established a new seven-month low yesterday, has sustained the strong bearish trend that has been in place since the drop from 1.6300 resistance in the very beginning of the year. After making a pivotal breakdown in mid-January below the key 1.6000 level and an important bullish support trend line extending back to the June 2012 1.5266 low, price dropped further to breakdown below successively lower support levels. On the longer-term weekly chart, this downside move can be seen as a significant breakdown below a large triangle pattern, which highlights the magnitude of the current bearish trend.
The most recent support breakdown occurred mid-week last week on a breach below 1.5600, with a downside objective around 1.5400 support. Currently, price has approached this support level. A further breakdown below the 1.5400 level could potentially move towards further support around the 1.5250 area long-term lows. Yet a further downside price objective on a continuation of the bearish trend resides around the important 1.5000 region, a level not reached since mid-2010.