GBP USD carries continued downside risk
GBP/USD (daily chart shown below) began the new trading week with a slight relief rally after last week’s sustained plummet, but continues to carry significant […]
GBP/USD (daily chart shown below) began the new trading week with a slight relief rally after last week’s sustained plummet, but continues to carry significant […]
GBP/USD (daily chart shown below) began the new trading week with a slight relief rally after last week’s sustained plummet, but continues to carry significant downside risk.
From its multi-year high of 1.7190 in mid-July, the currency pair has spent more than a month in a virtual freefall that has swiftly broken down below several major support levels. This includes a simultaneous breakdown below the key 1.7000 level and the 50-day moving average in late July, and then a further breakdown below the key 1.6700 level and the 200-day moving average in mid-August.
Having just hit almost a five-month low of 1.6534, GBP/USD is now trading just above its major 1.6500 support level. The current sustained plunge has created a decline of around 3.8% in just over a month thus far, which highlights the currency pair’s marked weakness and severely interrupts the strong bullish trend that had firmly been in place for an entire year between July of 2013 and July of 2014.
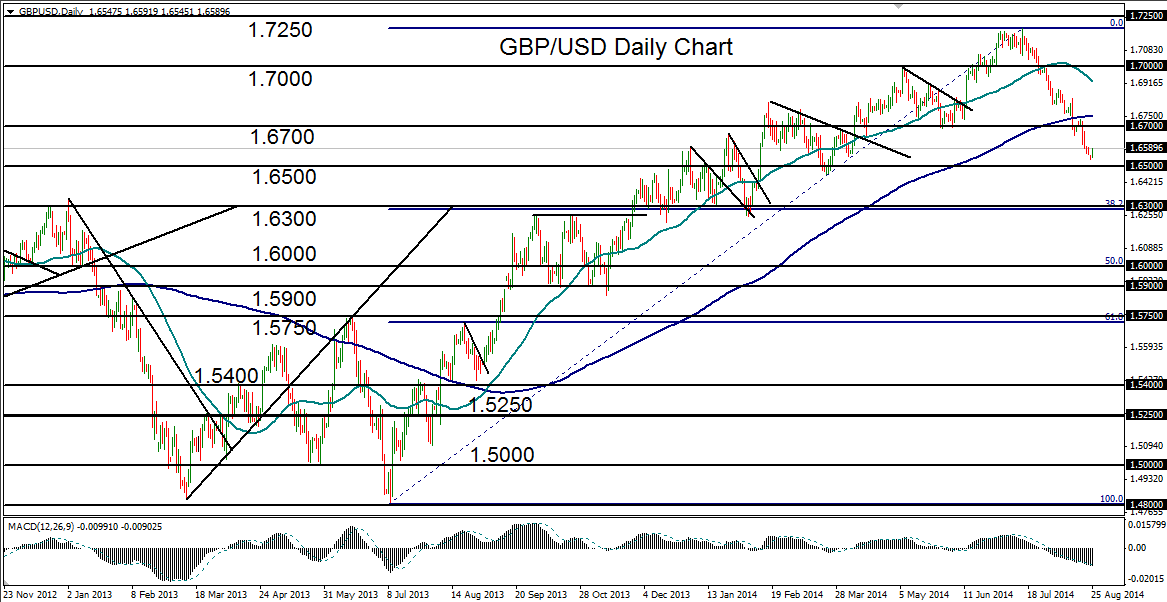
Despite the minor relief rally to start the new week, the overall directional bias continues to be bearish for the time being. Any breakdown and sustained trading below the noted 1.6500 support level would have a clear potential downside target around the key 1.6300 level, which is not only a major support/resistance area, but is also around the 38% Fibonacci retracement of the noted one-year bullish trend.
To the upside, any further rebound should meet strong resistance around the 1.6700 former support level.
