GBP USD bounces back on UK employment data faces major resistance
Much like yesterday afternoon, it has been a relatively quiet day in the FX markets due to the lack of any significant Eurozone or US […]
Much like yesterday afternoon, it has been a relatively quiet day in the FX markets due to the lack of any significant Eurozone or US […]
Much like yesterday afternoon, it has been a relatively quiet day in the FX markets due to the lack of any significant Eurozone or US data, and as North American banks are closed in observance of Veterans Day. But luckily, we’ve had some important employment data from the UK which caused a bit of volatility in the pound. Although wage growth was slightly weaker than expected, the jobs figures were eye catching nonetheless for the unemployment rate dropped to its lowest level since 2008 while the employment rate hit its highest level since records began in 1971. As a result, the pound initially dropped before recovering all of its post-data losses. The GBP/USD was not too far off this week’s high of 1.5185 as we went to press; it was testing a key resistance level at around 1.5170.
According to the ONS, the rate of unemployment in the 3 months to September unexpectedly dropped to 5.3% from 5.4% previously as the employment rate climbed to 73.7%. Earnings excluding bonuses were up 2.5% while including bonuses they were 3.0%, below expectations of 3.2% and unchanged from the prior three-month average. Meanwhile the number of people claiming unemployment-related benefits during the previous month rose by an above-forecast 3,300 applications versus 1,600 expected. September’s figures were revised sharply to show a 500 rise in unemployment claims versus 4,600 reported initially.
So, overall it was a decent jobs report, although economists were looking for even stronger figures. However, the data is unlikely to significantly alter the view of the Bank of England’s monetary policy committee. Interest rates will most likely remain at their current record low levels at least until the second half of 2016. The Federal Reserve meanwhile is likely to raise rates in December or in the first quarter of next year. The disparity of monetary policy between the UK and US therefore point to significantly lower levels for the GBP/USD over the coming weeks and months – unless inflation in the UK unexpectedly starts to rise sharply over the coming months.
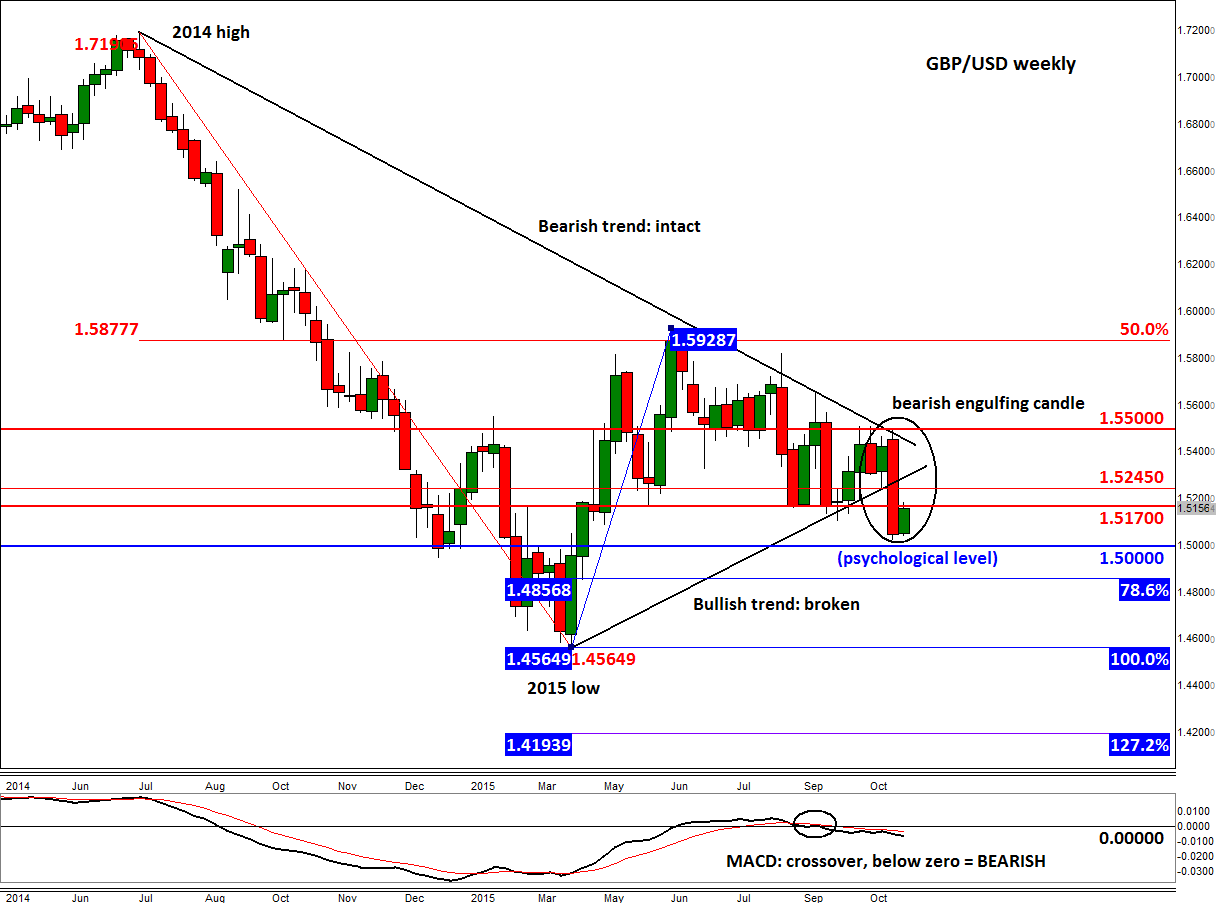
Indeed, following a lengthy consolidation for much of this year, it looks like the GBP/USD has decided to move lower. Last week, it formed a large bearish engulfing candle on the weekly chart after the Bank of England delivered a very dovish Inflation Report. As a result, the Cable broke through a bullish trend line that had been in place since April. In the process, several supports such as 1.5245 and 1.5170 were taken out. The latter is where price was trading around when this report was written. So it could head lower from here and descend towards the psychologically important 1.5000 handle over the next several days. Over time it is likely to revisit and potentially break the April low of 1.4565, before falling towards the 127.2% extension level at 1.4195 and then the next psychological level at 1.4000. For as long as the Cable remains below the bearish trend off the 2014 high and below major resistance at 1.5500, the long-term technical outlook would remain bleak. The short-term outlook would turn slightly bullish should resistance at 1.5245 break down.
In short, because of the technical breakdown and the BoE turning dovish, traders should watch the key resistances such as 1.5170 and 1.5245 closely now as it is likely the Cable could turn lower from these levels. But the short-term outlook would turn slightly bullish if 1.5245 is taken out.