GBP USD bears get pound ed
Here in the US, the just-concluded Labor Day holiday marks the unofficial end of summer, when traders return from their beach cabins and refocus on […]
Here in the US, the just-concluded Labor Day holiday marks the unofficial end of summer, when traders return from their beach cabins and refocus on […]
Here in the US, the just-concluded Labor Day holiday marks the unofficial end of summer, when traders return from their beach cabins and refocus on the markets. Historically, this period also marks the return of more volatile markets after the so-called “summer doldrums,” though if anything, many traders would actually prefer a respite from this year’s abnormally volatile August. One way or another though, sharp market moves are likely ahead of the Federal Reserve’s highly-anticipated meeting on September 16th.
One pair that continues to be buffeted by sharp volatility is GBP/USD. After falling around 250 pips amidst consistent selling last week, the unit has rallied sharply so far this week. This week’s surge, which has already unwound all of last week’s selling, is hardly surprising; after all, there was no obvious fundamental catalyst for last week’s selloff. Last week’s UK PMI reports were slightly weaker than anticipated, but the Bank of England nonetheless remains on track to hike interest rates at some point in the first half of next year, so the dramatic 600-pip selloff from the late August high above 1.5800 appeared unwarranted. Ahead this week, traders will be watching out for UK Manufacturing Production data and the NIESR GDP Estimate on Wednesday, the September BOE meeting and statement on Thursday, and PPI data out of the US on Friday.
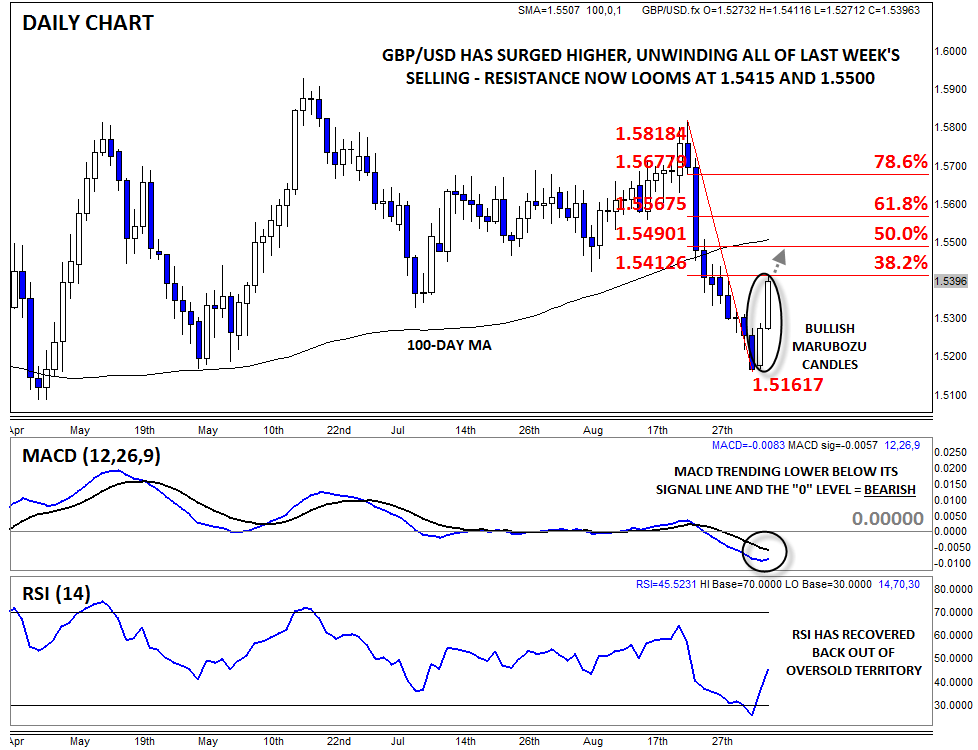
Technical View: GBP/USD
Turning our attention to the chart, it’s clear that GBP/USD is seeing strong buying pressure as we go to press. The unit is working on its second consecutive Bullish Marubozu candle,* signaling strong buying pressure heading into the middle of the week. That said, GBP/USD’s bullish explosion may soon encounter some resistance.
The 38.2% Fibonacci retracement of the two-week drop comes in at 1.5415, near current market prices, and if the unit is able to overcome that barrier, the convergence of the 100-day MA and 50% Fibonacci retracement looms up around the 1.5500 level. To the downside, a break below the 200-day MA at 1.5350 would shift the near-term odds back in favor of the bears.
* A Marubozu candle is formed when prices open very near to one extreme of the candle and close very near the other extreme. Marubozu candles represent strong momentum in a given direction.
 Source: City Index