GBP USD Attempts to Continue Upside Recovery
April 29, 2013 – GBP/USD (daily chart) has attempted to continue its upside recovery from late last week, when price broke out cleanly above key […]
April 29, 2013 – GBP/USD (daily chart) has attempted to continue its upside recovery from late last week, when price broke out cleanly above key […]
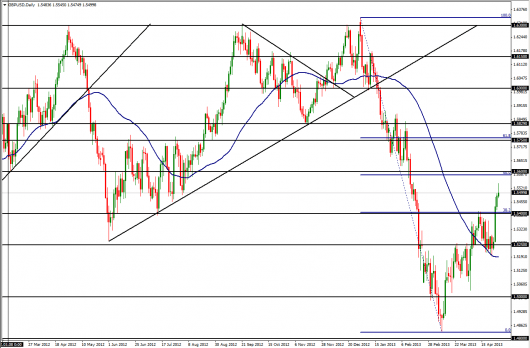
April 29, 2013 – GBP/USD (daily chart) has attempted to continue its upside recovery from late last week, when price broke out cleanly above key resistance in the 1.5400 price region. This previous resistance level was also around the 38.2% Fibonacci retracement of the long plummet from the 1.6337 high in the very beginning of the year to the 1.4830 low in mid-March. After having broken out above 1.5400 last Thursday, the following day saw a continuation of the upside momentum. This week, Monday’s price action saw a high at 1.5545 before pulling back to the downside.
With the key 1.5400 price region now serving as tentative support within the current recovery attempt, major upside resistance currently resides around the 1.5600 price region, which is in the vicinity of the 50% Fibonacci retracement of the noted decline from the beginning of the year. In the event of a breakout above that level, which would further extend the upside recovery, a key price objective resides around the 1.5750 price region, around the 61.8% Fibonacci retracement level.