GBP USD attempts rebound and recovery
GBP/USD (daily chart shown below) has attempted a rebound and recovery from its key 1.6700 support level up towards its long-term highs within the past week. […]
GBP/USD (daily chart shown below) has attempted a rebound and recovery from its key 1.6700 support level up towards its long-term highs within the past week. […]
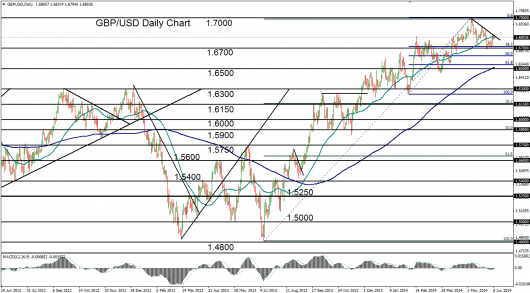
GBP/USD (daily chart shown below) has attempted a rebound and recovery from its key 1.6700 support level up towards its long-term highs within the past week.
In the process, the currency pair has risen once again back up to its 50-day moving average. This exhibits the continuing magnitude of strength that the pound has generally maintained against the US dollar for the past year, in contrast to other major currencies.
For over a month, GBP/USD has declined in a measured pullback move from its four-year high of 1.6995 that was reached in early May. This pullback has formed a month-long descending trend line that has not yet been breached to the upside.
Price action is currently in consolidation at the important juncture of this short-term trend line and the 50-day moving average.
With any significant breakout above this resistance juncture, a recovery from the current pullback should be in order. The upside target in this event would once again reside at the 1.7000 level for a potential resumption of the current uptrend.
To the downside, for any potential breakdown and extension of the pullback below the noted 1.6700 support level, which also happens to be a key 38.2% Fibonacci retracement level, a further downside support target resides around the 1.6500 level and the 200-day moving average.
