GBP USD advances to approach multi year high
GBP/USD (daily chart) has once again risen to approach its 2+ year high at 1.6602, which was established at the very beginning of 2014. After […]
GBP/USD (daily chart) has once again risen to approach its 2+ year high at 1.6602, which was established at the very beginning of 2014. After […]
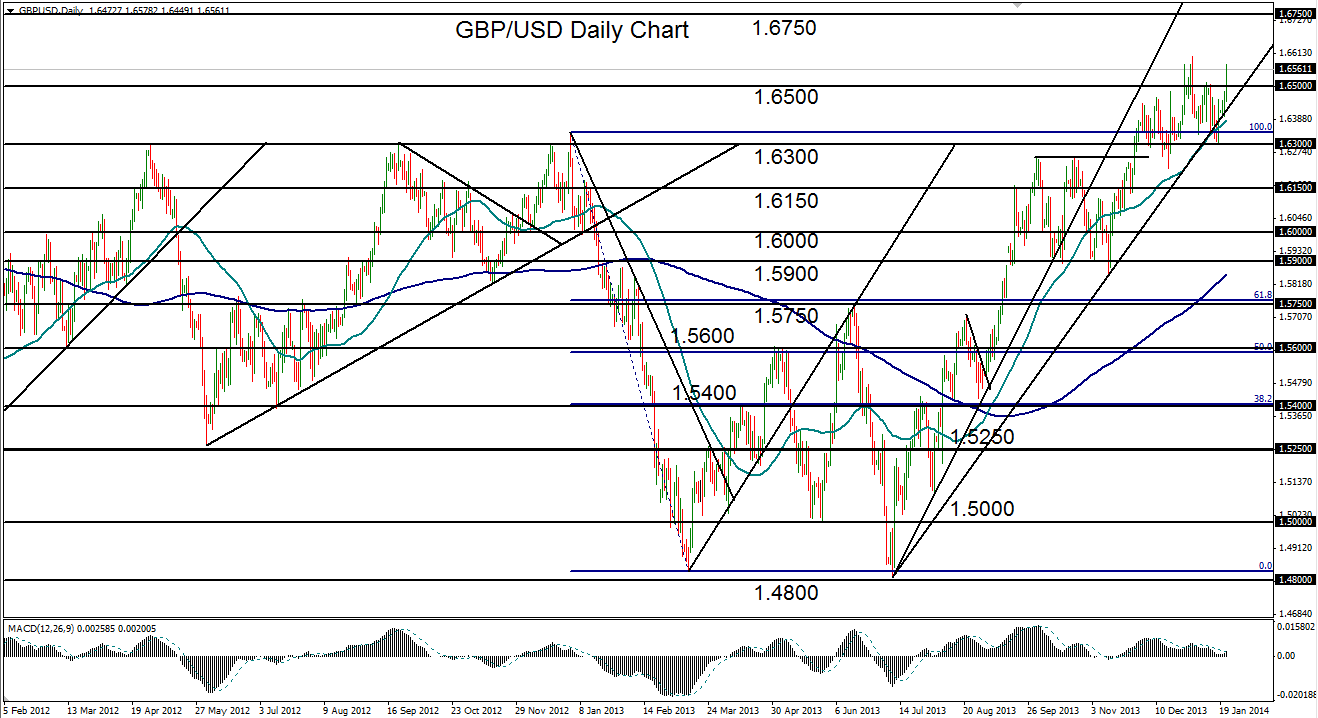
GBP/USD (daily chart) has once again risen to approach its 2+ year high at 1.6602, which was established at the very beginning of 2014. After that New Year’s high was reached, the currency pair pulled back and then rebounded in mid-January off the major 1.6300 support level, as expected. The 1.6300 level has served as exceptionally strong resistance and support in the past few years. In pulling back to 1.6300 last week, GBP/USD dipped slightly below the currently defining bullish trend line that extends back to the 1.4800-area double-bottom low that was hit in July 2013.
Despite that dip, the sharp rebound that has been in play since the end of last week has given renewed strength to the half-year uptrend. While major resistance resides immediately above at the noted 1.6600-area multi-year high, the technical outlook for GBP/USD continues to carry a substantial bullish bias and should continue to reach for higher highs. On a breakout above 1.6600, the near-term upside resistance target resides around the 1.6750 level, which would further extend the bullish trend, and then the 1.7000 resistance level. Key downside support continues to reside around the well-tested 1.6300 level