GBP USD advances to 1 5400 resistance
GBP/USD (daily chart shown below) has advanced to key resistance around the 1.5400 level. This rise follows a tentative breakout above both a key downtrend […]
GBP/USD (daily chart shown below) has advanced to key resistance around the 1.5400 level. This rise follows a tentative breakout above both a key downtrend […]
GBP/USD (daily chart shown below) has advanced to key resistance around the 1.5400 level. This rise follows a tentative breakout above both a key downtrend resistance line extending back to last year’s 1.7190 high, as well as the 50-day moving average.
Currently, GBP/USD is in a pullback/rebound within a seven-month downtrend that has seen the currency pair drop by 13% in half a year, from the noted 1.7190 high in July down to the recent 1.4950 low in late January.
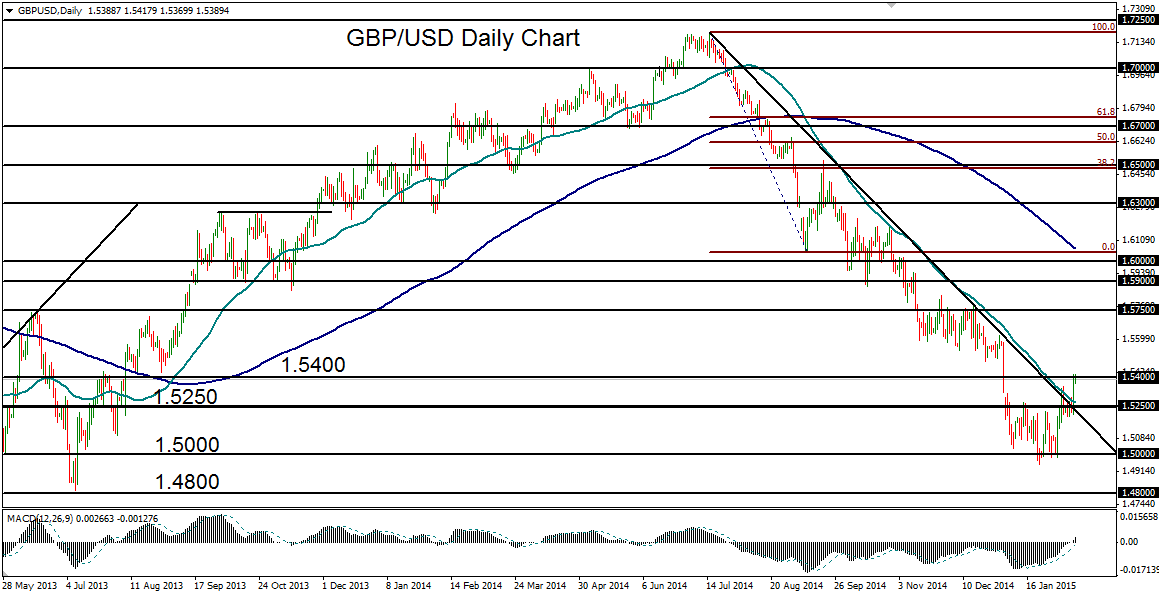
After having hit that 1.4950 low three weeks ago, slightly below key psychological support at 1.5000, price action has risen sharply in a significant rebound up to the current 1.5400 resistance area.
Despite this rebound, bearish pressure within the entrenched downtrend continues to weigh on GBP/USD, potentially limiting its near-future upside.
A turn back to the downside at or near the current resistance should begin to target 1.5250 and 1.5000 once again. In the event of a further advance on the current rebound, major resistance above 1.5400 resides around the 1.5600 level.
