FX technical outlook
Technical Developments to Watch: · EUR/USD bulls may look to target further upside at or above 1.1450 resistance after rally on weakened dollar · GBP/USD […]
Technical Developments to Watch: · EUR/USD bulls may look to target further upside at or above 1.1450 resistance after rally on weakened dollar · GBP/USD […]
Technical Developments to Watch:
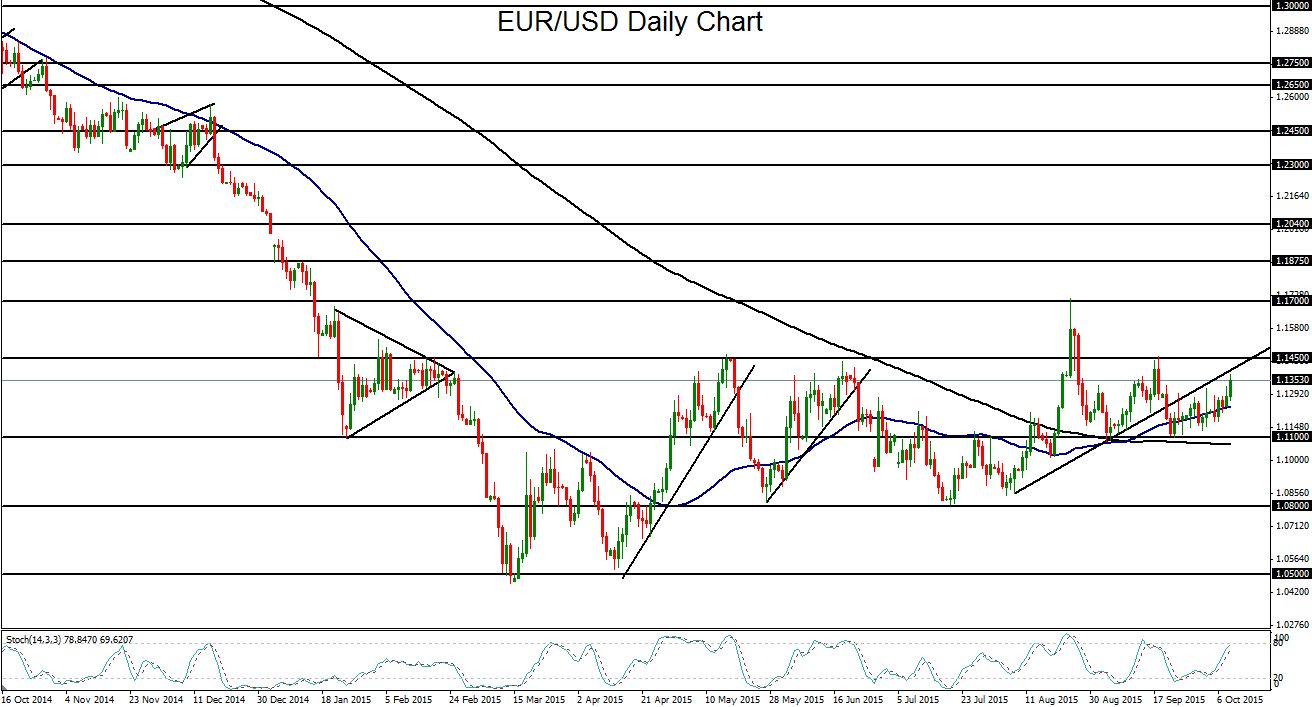
· EUR/USD bulls may look to target further upside at or above 1.1450 resistance after rally on weakened dollar
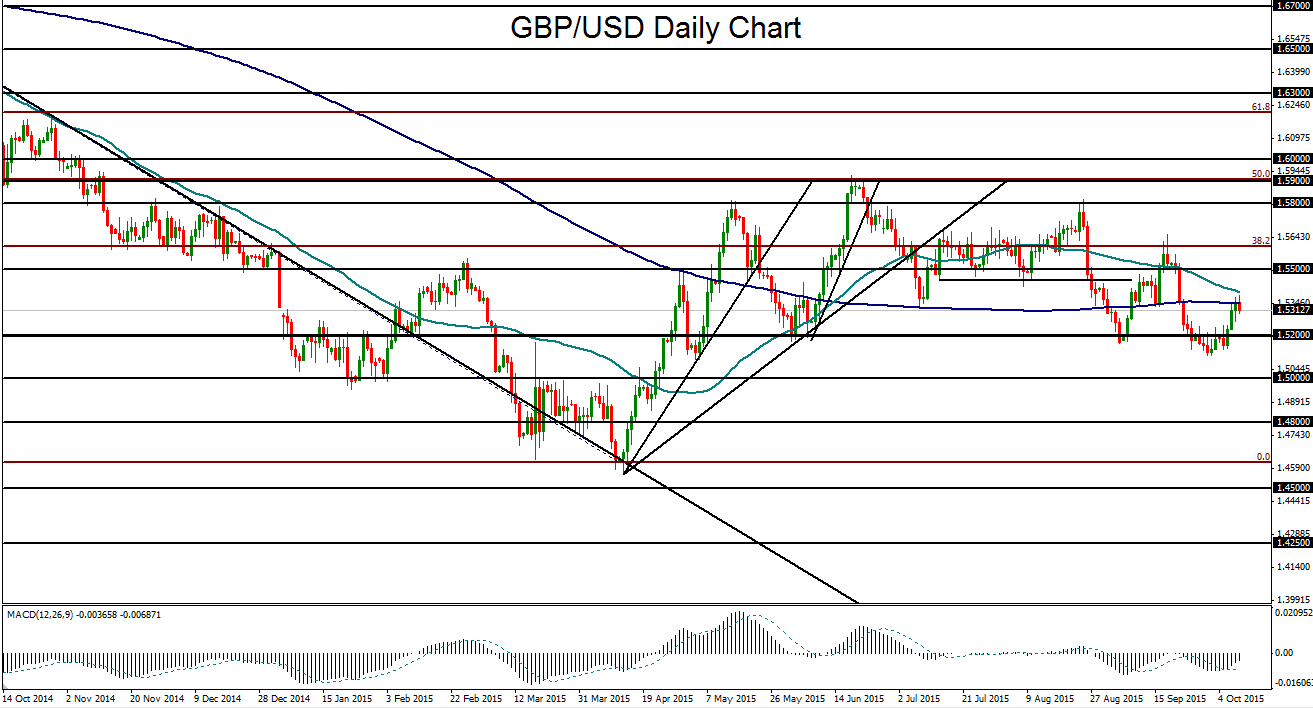
· GBP/USD facing resistance and could turn lower back towards 1.5000
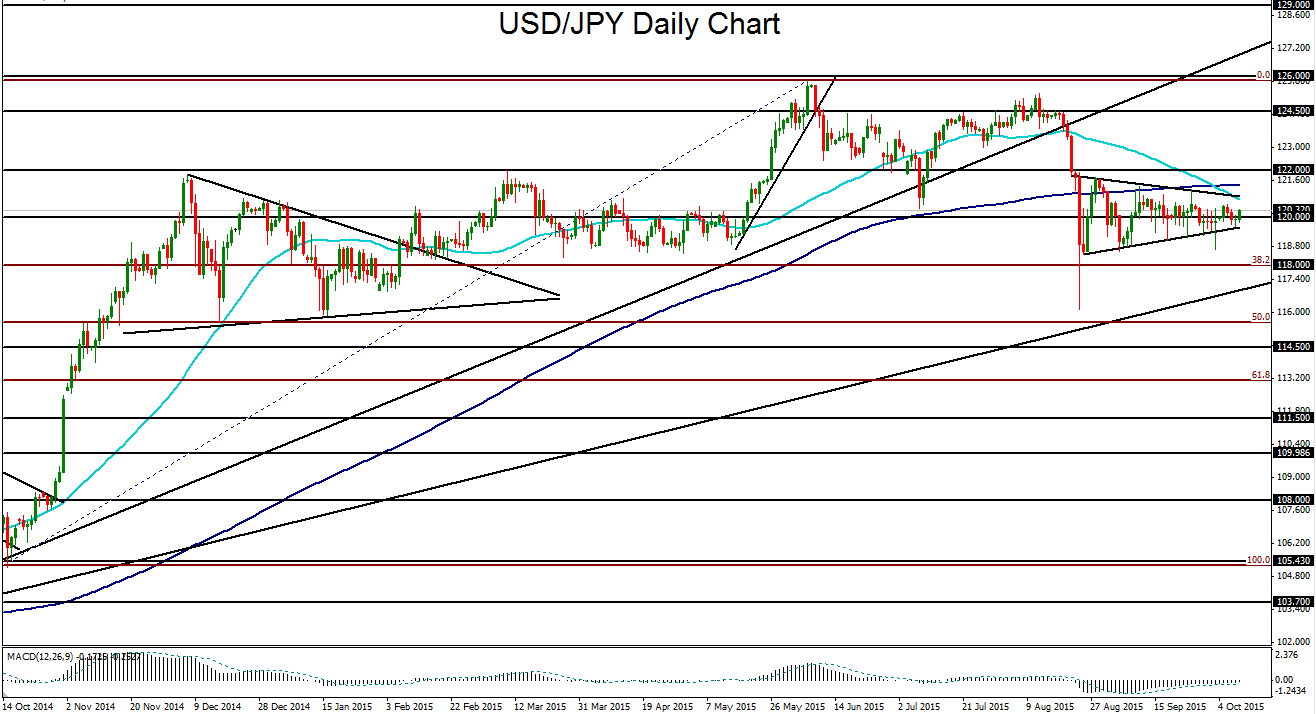
· USD/JPY moving average “death cross” and tight triangle consolidation still in play
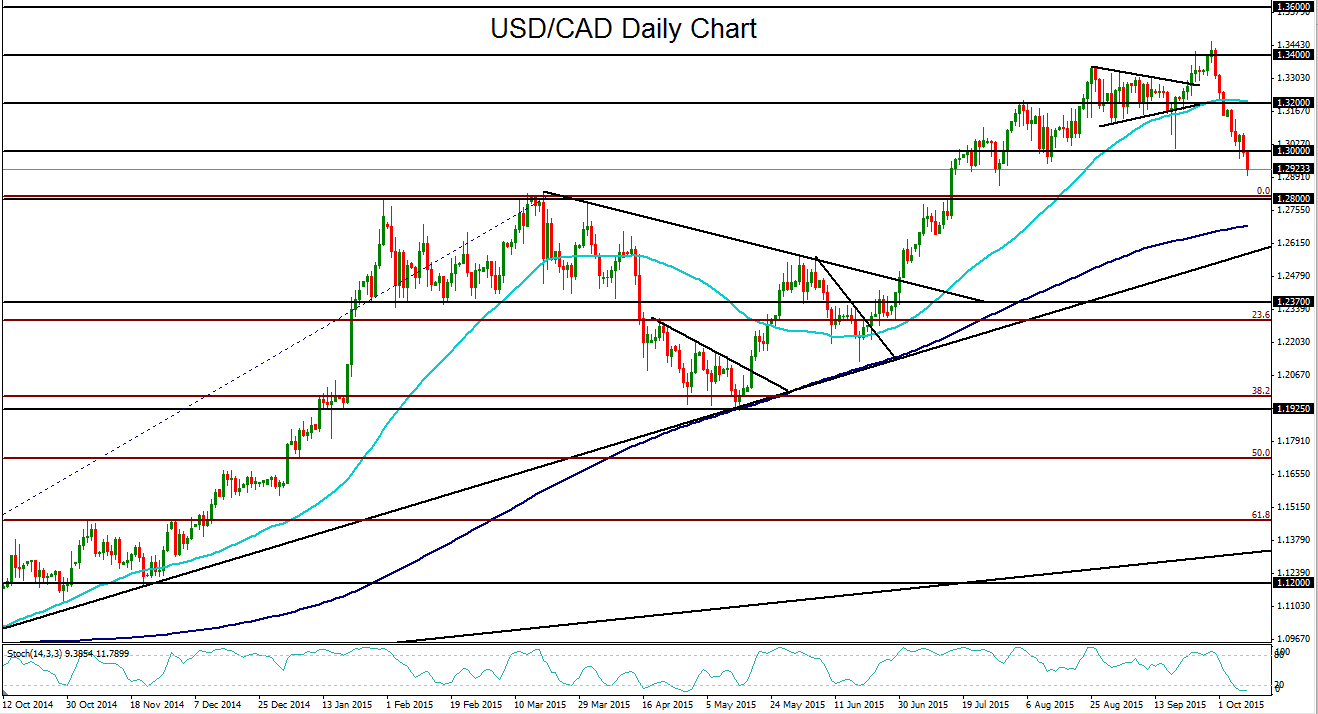
· USD/CAD bounce possible around or above 1.2800 support
EUR/USD
The past week saw EUR/USD continue its steady climb on a weakened US dollar. The upper border resistance of the current consolidation is around the 1.1450 level. Bulls may look to further target that level and above on a continued dollar pullback. Any sustained rise above 1.1450 could switch momentum back to the bulls as EUR/USD looks to recover possibly towards the 1.1700 highs. Major support remains at the 1.1100 level and 200-day moving average.
GBP/USD
GBP/USD climbed in the past week from below 1.5200 up to approach the 1.5400 level. In the process, the currency pair has reached back up to its relatively flat and closely-situated 200-day and 50-day moving averages. With any further rebound momentum, major resistance lies at the 1.5500 level. But at or below that level, a turn back down to 1.5200 should once again begin targeting the 1.5000 psychological support objective.
USD/JPY
USD/JPY has continued to range-trade in a converging consolidation, otherwise known as a triangle pattern. This pattern has been in place since late August. Of particular note from a technical perspective, the 50-day moving average has recently crossed below the 200-day moving average, creating a potential “death cross” technical scenario that could presage further downside for USD/JPY in the event of a return to global market volatility and a potential flight to the yen. On any breakdown below the triangle pattern, the currency pair could then target the next major objectives at the 118.00 and then 116.00 support levels. Upside resistance on any sustained trading above 120.00 continues to reside around the upper border of the noted triangle pattern.
USD/CAD
USD/CAD has spent the past couple of weeks plunging from late September’s 11-year high of 1.3456. This sustained drop has been the result of rebounding crude oil prices combined with a pullback in the US dollar. Having broken down below the 1.3000 psychological support level, USD/CAD could be poised for further downside as perceptions of a more dovish Fed weigh on the US dollar and help give a further boost to crude oil. At the same time, however, major support continues to loom directly below around the 1.2800 level, which represents the previous long-term highs before the upside breakout in mid-July. On any continued move down to approach 1.2800, USD/CAD should find support and a possible rebound and recovery after its recent sharp slide.