FX analysis technical outlook September
EUR/USD EUR/USD spent much of last week in a tight consolidation above key 1.1100 support after having dropped down to test that support level […]
EUR/USD EUR/USD spent much of last week in a tight consolidation above key 1.1100 support after having dropped down to test that support level […]
EUR/USD
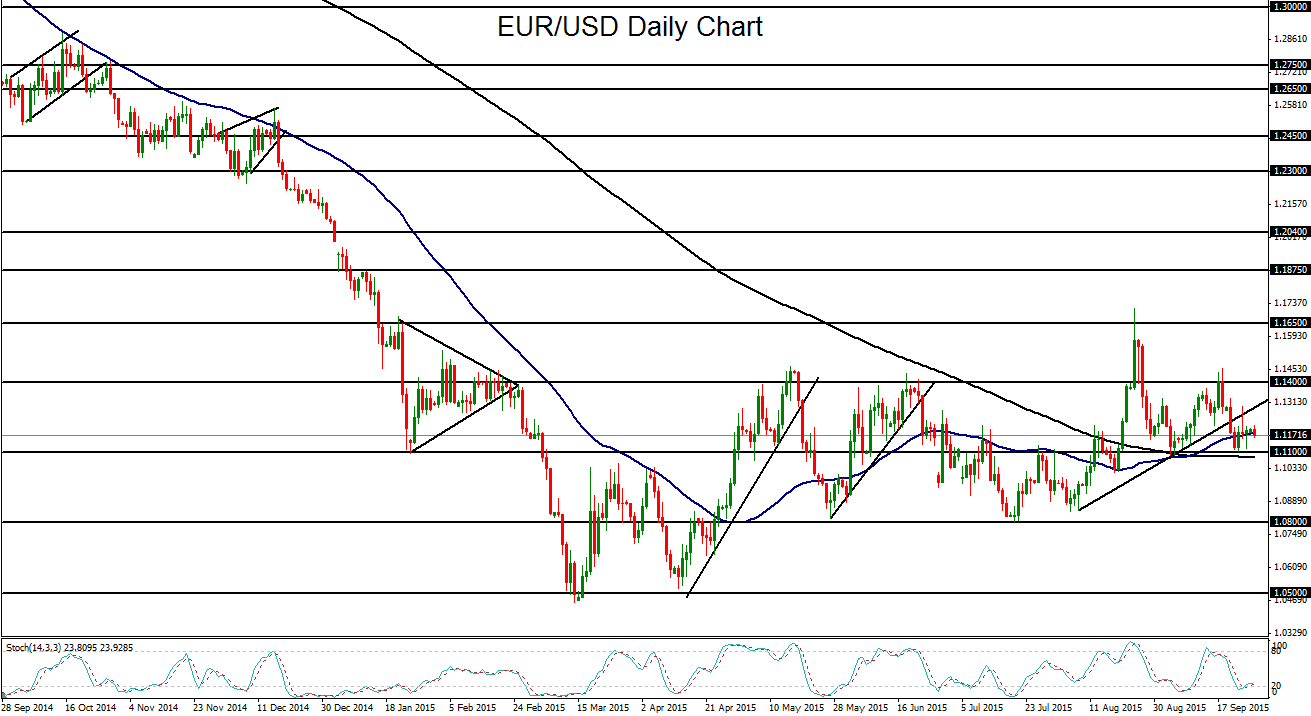
EUR/USD spent much of last week in a tight consolidation above key 1.1100 support after having dropped down to test that support level early in the week. The 200-day moving average has been running parallel with and slightly under this level since early September, providing some additional technical support for the currency pair. The beginning of last week saw a breakdown below a short-term uptrend support line going back to early August. This breakdown was fueled by extended anticipation of a Fed interest rate hike in the US and continued expectations for this rate rise to occur sometime this year, thereby supporting US dollar strength. As the new trading week begins, EUR/USD continues to be pressured to the downside, as these expectations continue to prop up the dollar. The key downside event to watch for would be a breakdown below the noted 1.1100 support level and 200-day moving average. Such a breakdown should trigger a return to the long-term bearish bias that has been in place since the current downtrend began in May of last year. In the event of this breakdown, the next major target to the downside is at the key 1.0800 support level.
GBP/USD
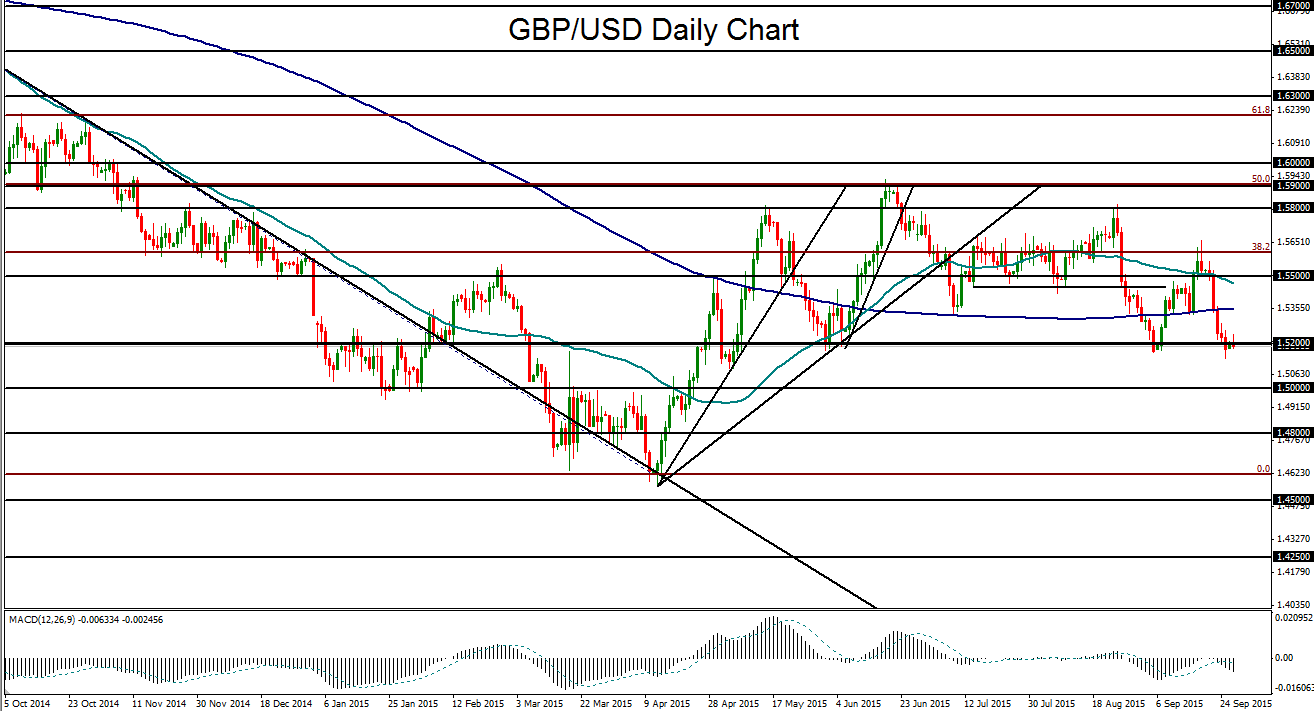
GBP/USD plummeted for virtually all of last week as the pound fell substantially against the dollar, euro, and yen, among other major currencies. From its perch around the 1.5500 level early last week, GBP/USD fell all the way down below its key 1.5200 support target by the end of last week for a significant 2% drop in the course of just five days. In the course of this drop, the currency pair fell below both its 50-day and 200-day moving averages. Having reached down to its noted downside target at 1.5200, GBP/USD should continue to be pressured by US dollar strength, especially in light of continued signals from the Fed regarding a likely 2015 rate hike. If the current downside momentum is sustained below the 1.5200 level, the next major bearish target is at the 1.5000 psychological support level, which has served as both support and resistance since the beginning of the year. Any further downside move could then begin to target the key 1.4800 support objective.
AUD/USD
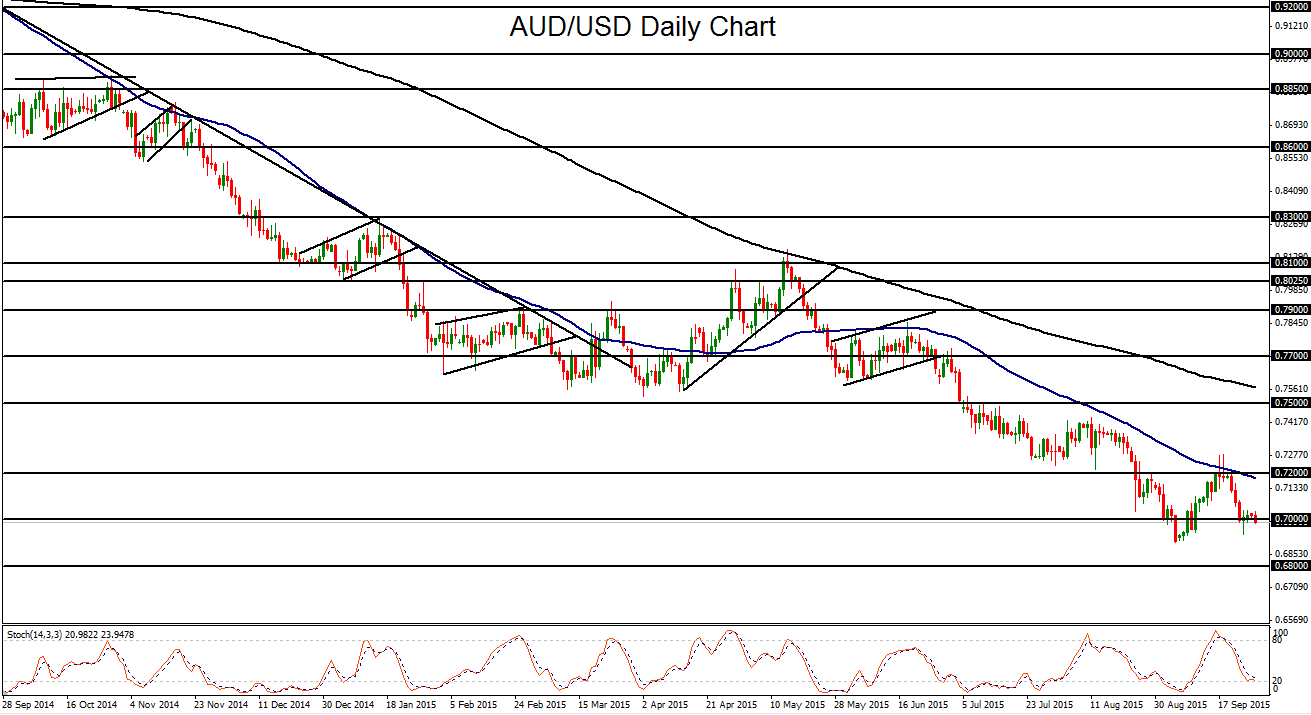
AUD/USD also spent the better part of last week in a substantial slide. Dropping from its 0.7200 resistance area and the 50-day moving average in the beginning of last week, AUD/USD followed through to the downside to hit the 0.7000 psychological support level by the end of the week. To begin the new week, the currency pair has experienced further pressure below 0.7000 as Fed members continue to present a progressively stronger case for a US interest rate hike this year. The downtrend for AUD/USD is strong and well-established back to mid-year last year. With continued pressure on the currency pair from a strong US dollar and weak commodity prices, AUD/USD should likely resume its bearish trend towards lower long-term lows. With sustained trading below the 0.7000 level, AUD/USD could soon re-test its 0.6900-area six-year low that was just established early this month. In that event, the next major downside target is at the key 0.6800 support objective.
