FX Analysis and Technical Outlook Fed Fueled Rollercoaster Continues
Fed-Fueled Rollercoaster Continues In the midst of the G7 meetings of finance ministers and central bankers beginning in Japan, this week in foreign exchange was […]
Fed-Fueled Rollercoaster Continues In the midst of the G7 meetings of finance ministers and central bankers beginning in Japan, this week in foreign exchange was […]
Fed-Fueled Rollercoaster Continues
In the midst of the G7 meetings of finance ministers and central bankers beginning in Japan, this week in foreign exchange was largely focused on the anticipation of, and then reaction to, the Federal Reserve’s latest public communications. The minutes from last month’s FOMC meeting were released in the middle of the week, and the results represented yet another dizzying turn in what has become a Fed-fueled rollercoaster ride for the financial markets.
Although many Fed-watchers had already been anticipating a slightly more hawkish upturn from the FOMC this time around after months of apparently dovish-leaning statements, the central bank went a step further. The most salient aspect of April’s FOMC minutes was the fact that members deemed a June interest rate hike to be likely if Q2 economic data continued to improve as expected. This was among the strongest assertions in recent months from the Fed in support of a potentially imminent rate hike, and the financial markets immediately grasped onto its implications.
The US dollar swiftly strengthened while gold fell sharply from near its recent highs. Jittery stock markets, most notably in the US, experienced heightened volatility, at first plunging but then regaining stability and rebounding towards the end of the week.
In a Thursday press conference, New York Fed President William Dudley, who has traditionally been more of a dove, appeared to support the hawkishness of the FOMC minutes, asserting that a June or July rate hike would be reasonable.
The Fed Fund futures markets, which had been pricing-in sub-10% probabilities of a June rate hike in recent weeks, jumped up to ~20% shortly prior to the release of the FOMC minutes. Immediately after the release, the probability surged to a high of around 34% and has remained heightened not far from this level as of Friday.
In the aftermath of the release, while equity markets have subsequently appeared to shrug off the increased likelihood of a near-term rate hike, the US dollar and gold continue to be affected in expected ways. As of Friday morning, the dollar has remained well-supported and gold has continued to be pressured off its recent highs. With the latest series of rather positive economic data out of the US to further support the Fed’s hawkish turn, these trends could very likely continue in the run-up to the next FOMC meeting in June.
Next week is a relatively light week in terms of economic data releases from the US, with the notable exception of GDP data to be released next Friday. This will be the Preliminary GDP (second release) and should have a substantial impact on the Fed’s consideration of current US economic growth.
Technical Developments
USD/CAD
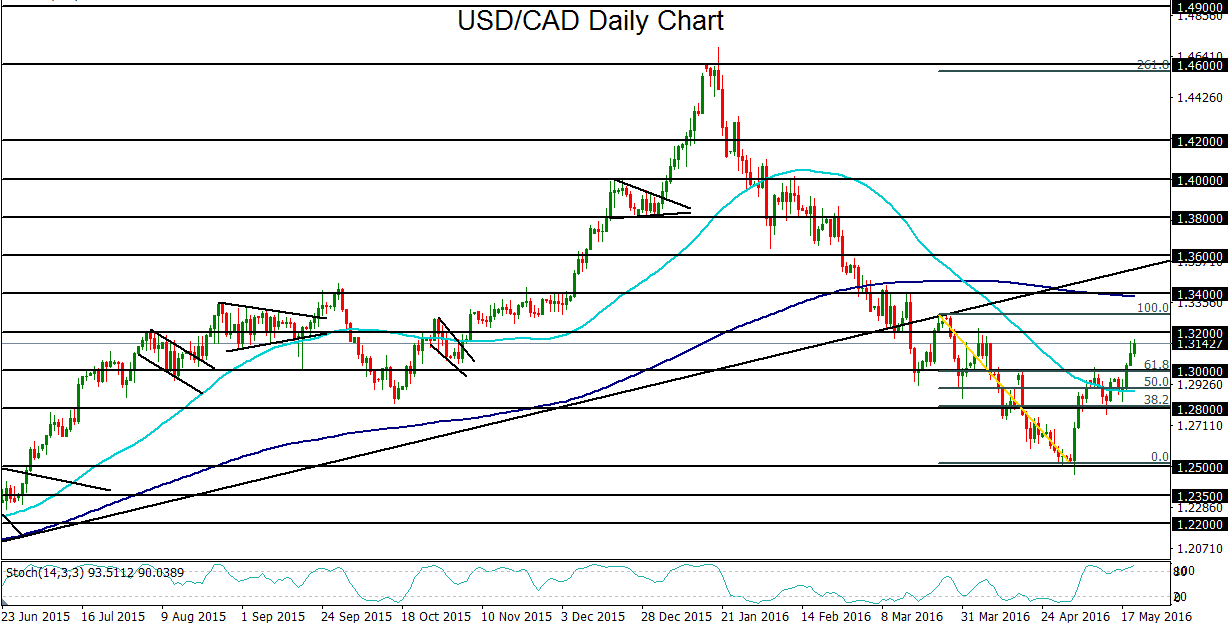
The combination of a strong US dollar driven by this past week’s hawkish FOMC minutes along with consolidating crude oil prices has led to a sharp surge and continuing recovery for USD/CAD. This week saw the currency pair break out above key prior resistance at the 1.3000 psychological level. That level was also the 61.8% Fibonacci retracement of the last bearish run from the late-March high down to the early-May 10-month low around 1.2500. In the process of breaking out above 1.3000, the currency pair has also broken well above its 50-day moving average. As recent crude oil supply disruptions continue to fade, and the US dollar remains driven in the short-term by renewed anticipation of an impending Fed rate hike, USD/CAD could potentially have significantly further to rise. In the event that the currency pair continues to trade above 1.3000, a further recovery for USD/CAD could see its next major upside target around the key 1.3400 resistance level, which is also where the 200-day moving average is currently situated.
USD/CHF
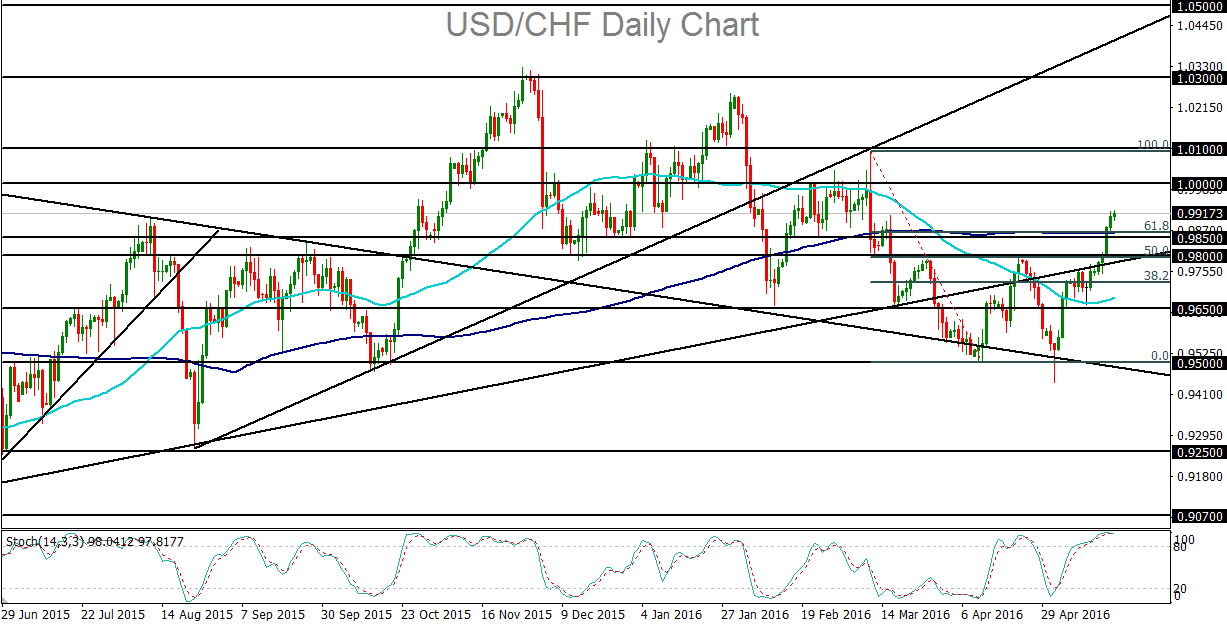
USD/CHF also broke out above a major resistance level this week as the dollar continued to surge. The currency pair breached 0.9800 resistance after the FOMC minutes were released, subsequently following through to the upside to rise above 0.9900. Prior to the breakout, the 0.9800 level had been tested twice since late March, but had not been broken. Although USD/CHF had generally been declining in a well-defined downtrend characterized by lower highs and lower lows since late last year, the past two months had seen the currency pair range-bound between 0.9800 resistance to the upside and 0.9500 support to the downside. The 0.9800 level was also the 50% Fibonacci retracement of the recent slide from the 1.0100-area high in March down to the 0.9500-area low in April. After the breakout above 0.9800, however, the range has been broken and the bias has turned strongly to the upside. For the first time since mid-March, the currency pair has also broken out above its 200-day moving average. Currently, the clear upside target after the breakout continues to be at parity (1.0000). With any further rise above parity in the run-up to the June FOMC meeting, the next major upside resistance targets are at 1.0100 and then 1.0300.
EUR/GBP
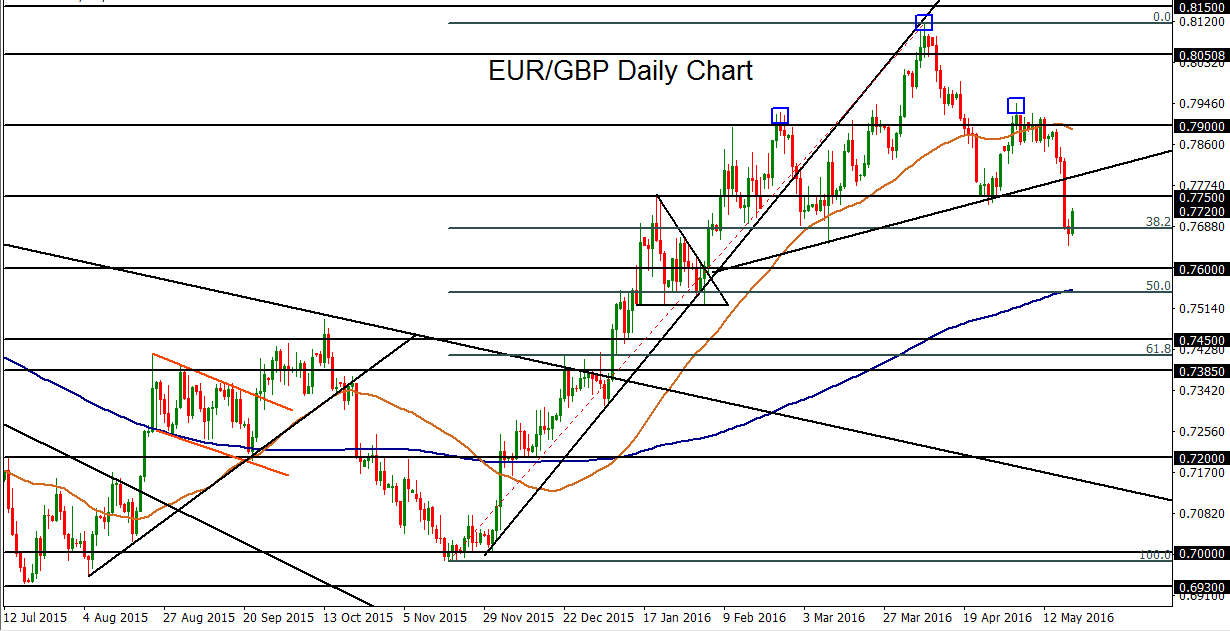
Pivoting away from the US dollar, EUR/GBP also saw some major moves this past week. The currency pair plunged below the neckline of a major head-and-shoulders pattern as the pound strengthened on better-than-expected employment/unemployment and retail sales numbers. This breakdown brought EUR/GBP down to the 38% Fibonacci retracement of the sharp uptrend from the 0.7000-area lows late last year up to April’s long-term high above 0.8100. Though the currency pair bounced on Friday, any subsequent break below the noted 38% Fib level could prompt a continuation of the head-and-shoulders breakdown towards the pattern’s measured target just below the 0.7400 level.
