FX Analysis and Technical Outlook 8211 January 29th 2016
Technical Developments USD/JPY has surged dramatically on the Bank of Japan’s cut to a negative interest rate, and could be on track to reverse its […]
Technical Developments USD/JPY has surged dramatically on the Bank of Japan’s cut to a negative interest rate, and could be on track to reverse its […]
Technical Developments
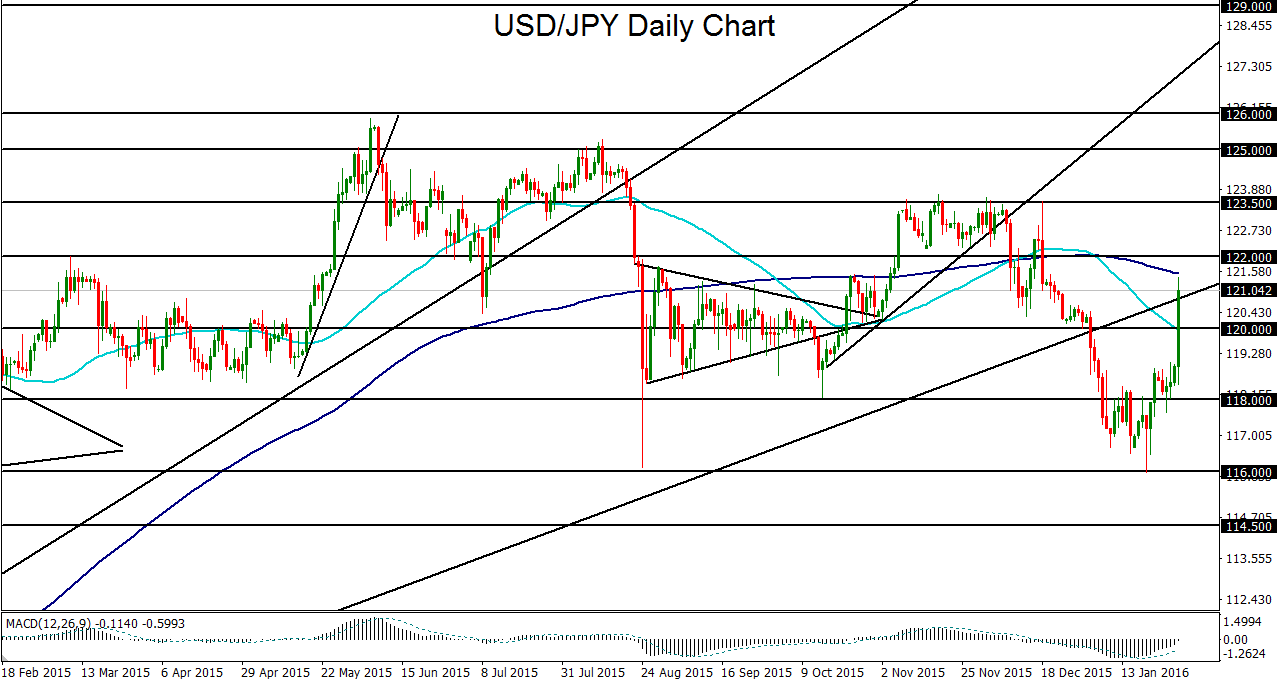
USD/JPY
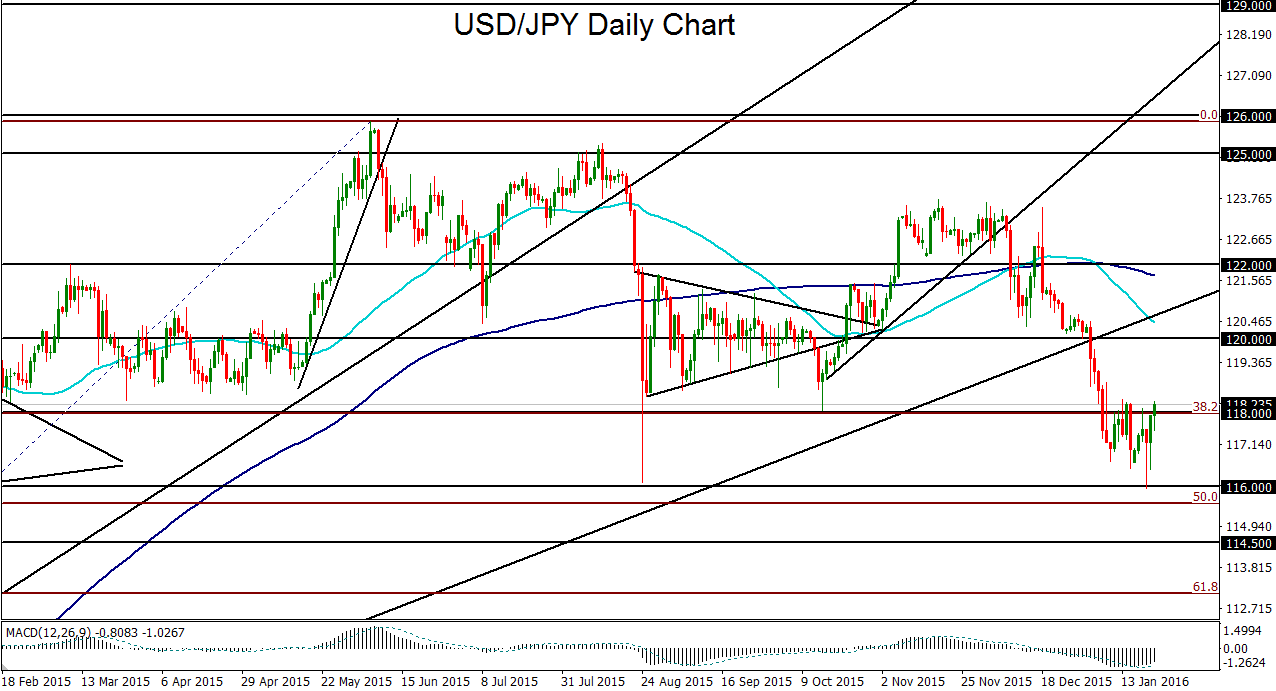
USD/JPY spent most of the past week in a moderate rise as global equity markets regained a measure of stability following a period of high volatility from the beginning of the year. This rise accelerated sharply on Friday after the Bank of Japan (BOJ) made an unexpected interest rate cut into negative territory that prompted the yen to plunge against other major currencies. USD/JPY initially shot up by over 300 pips on the news, pushing the currency pair above 121.00 to hit its 200-day moving average and begin targeting key resistance at 122.00. This surge follows more than a week of USD/JPY rising from major double-bottom support around the 116.00 level. The question now is whether Friday’s surprise BOJ rate cut is enough to push USD/JPY up to further highs, fully reversing the sharp plunge from mid-December. The Federal Reserve’s rather uneventful FOMC statement earlier in the week did little to move the dollar appreciably, so the yen plunge due to the BOJ’s negative rates should take center stage in directing USD/JPY’s course, at least on a shorter-term horizon. Heightened stock market volatility, which has so forcefully marked the first month of 2016, could be the one factor that tempers USD/JPY’s further rise. Although global equities have tentatively regained some composure after dropping precipitously for much of January, any return to significant volatility could lead to yen-buying and a pullback for USD/JPY. In the absence of this volatility, the key upside factors to watch on USD/JPY include the noted 200-day moving average and 122.00 resistance level. A breakout above these resistance areas could open the way towards further upside targets at the 123.50 and then 125.00 resistance levels. This bullish outlook would be invalidated on any re-break below the 50-day moving average and 120.00 support level.
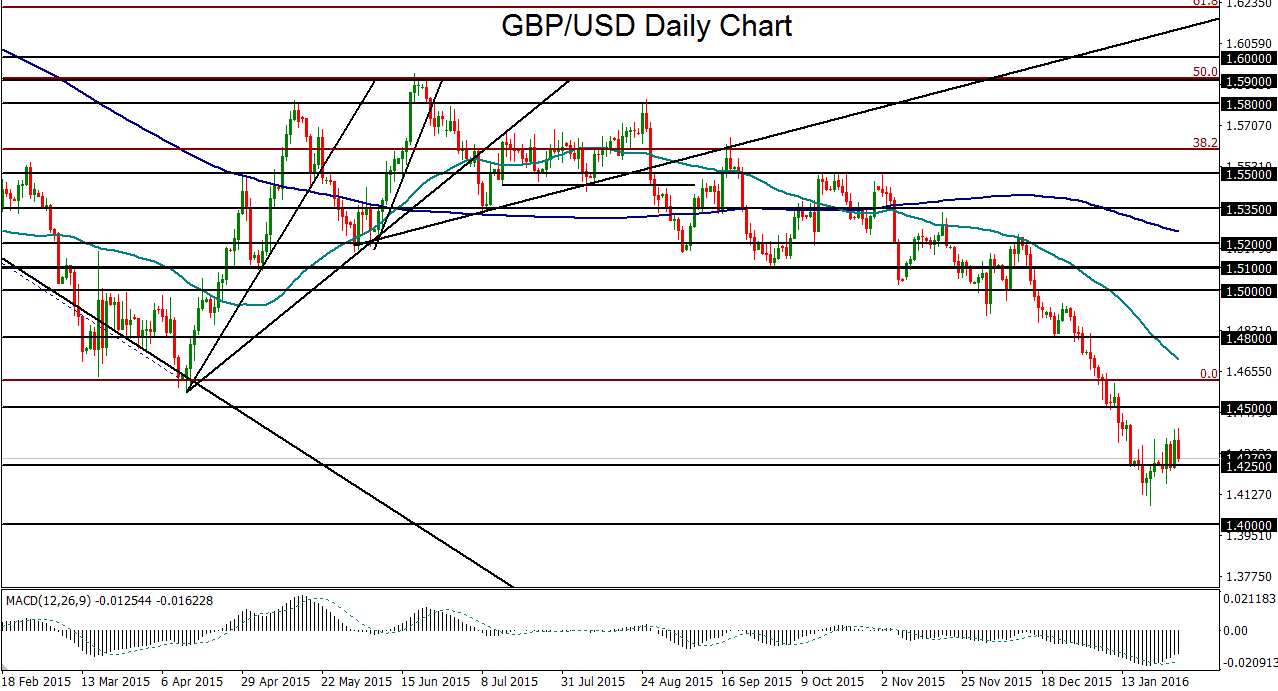
GBP/USD
GBP/USD has been entrenched in a tight consolidation above its multi-year lows for the past week. This consolidation and slight upside pullback follow months of sharp plunges that most recently culminated in nearly a six-year low of 1.4078 last week. Since that low, GBP/USD has repeatedly attempted an oversold relief rally but has been unable thus far to rise substantially off its lows. Given the continued doubt and uncertainty surrounding the Bank of England’s (BoE) inclination to follow the Federal Reserve’s lead in raising interest rates, the currency pair continues to trade within a strong downtrend that could soon see further long-term lows. Currently positioned around the key 1.4250 support level and having formed a bearish flag pattern, GBP/USD could soon be poised for a breakdown below the pattern, which would provide confirmation of the bearish trend bias. In that event, the next major downside target is at the 1.4000 psychological support level. Further to the downside, on any break below 1.4000, the next major price objective on a longer-term continuation of the sharp downtrend is at the 1.3600 level.
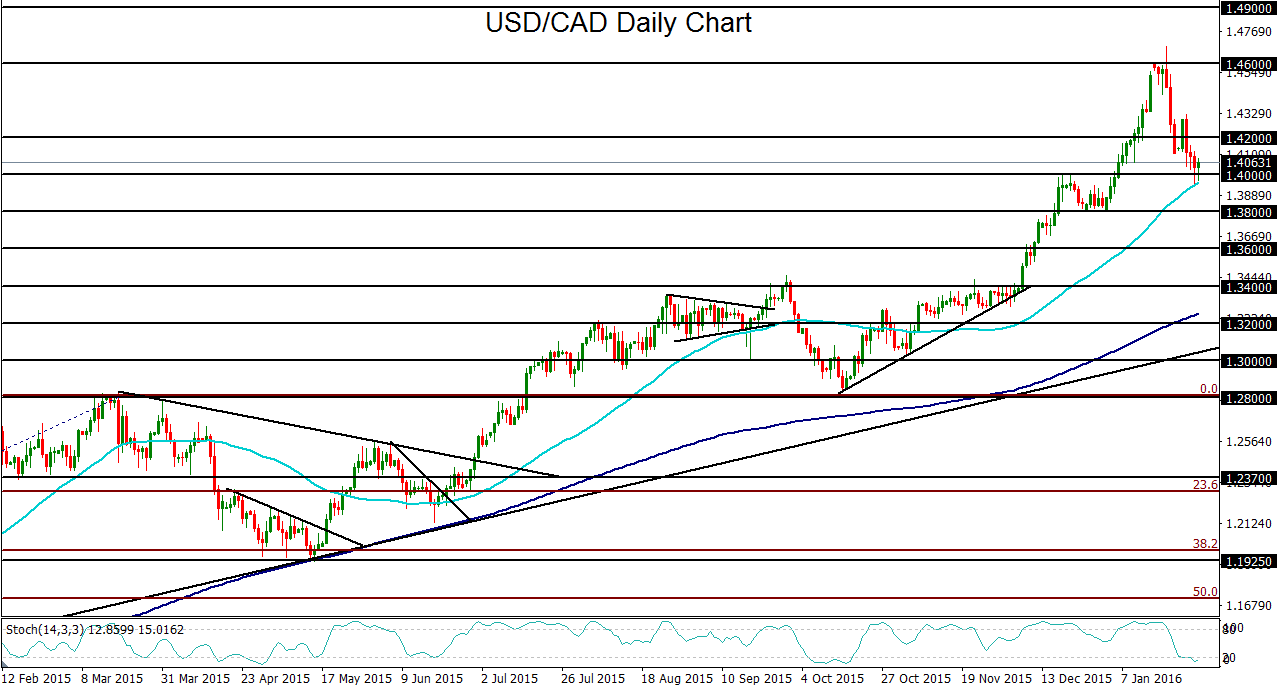
USD/CAD
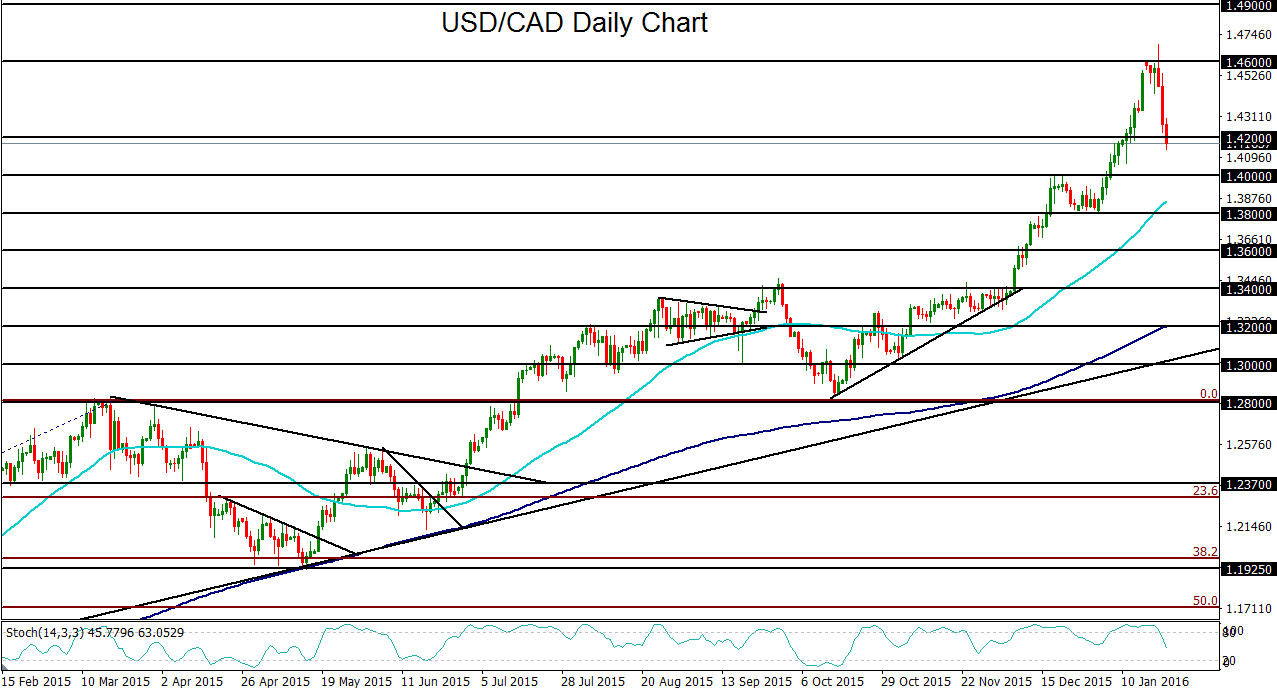
USD/CAD has just pulled back all the way down below key support around the 1.4000 level as well as its 50-day moving average, as the price of crude oil has rebounded and stabilized above its recent long-term lows. Prior to the past two weeks, Canada’s currency had been falling precipitously against the US dollar largely due to its correlation with crude oil, spurring a rapid rise for USD/CAD within the past several months. This rise reached its upside resistance target at 1.4600 before surging further to hit more than a 12-year high at 1.4688. The rise was then interrupted abruptly when the technically well-overbought currency pair made a sharp pullback from its highs as oil prices managed a relief rally. Based on a fundamentally bearish outlook for crude oil, USD/CAD’s current pullback, though significant, could be limited. Without a bona fide recovery in crude oil prices, the Canadian dollar should remain challenged and pressured. The technical bias for USD/CAD currently relies largely on whether the currency pair sustains trading above or below the key 1.4000 support/resistance level. Any turn to the upside from this level on a return of crude oil weakness could result in a move back up towards the original 1.4600 target. In the event of an extension of the current pullback with a breakdown below the 1.4000 level, the 1.3800 level is the next major support to the downside.
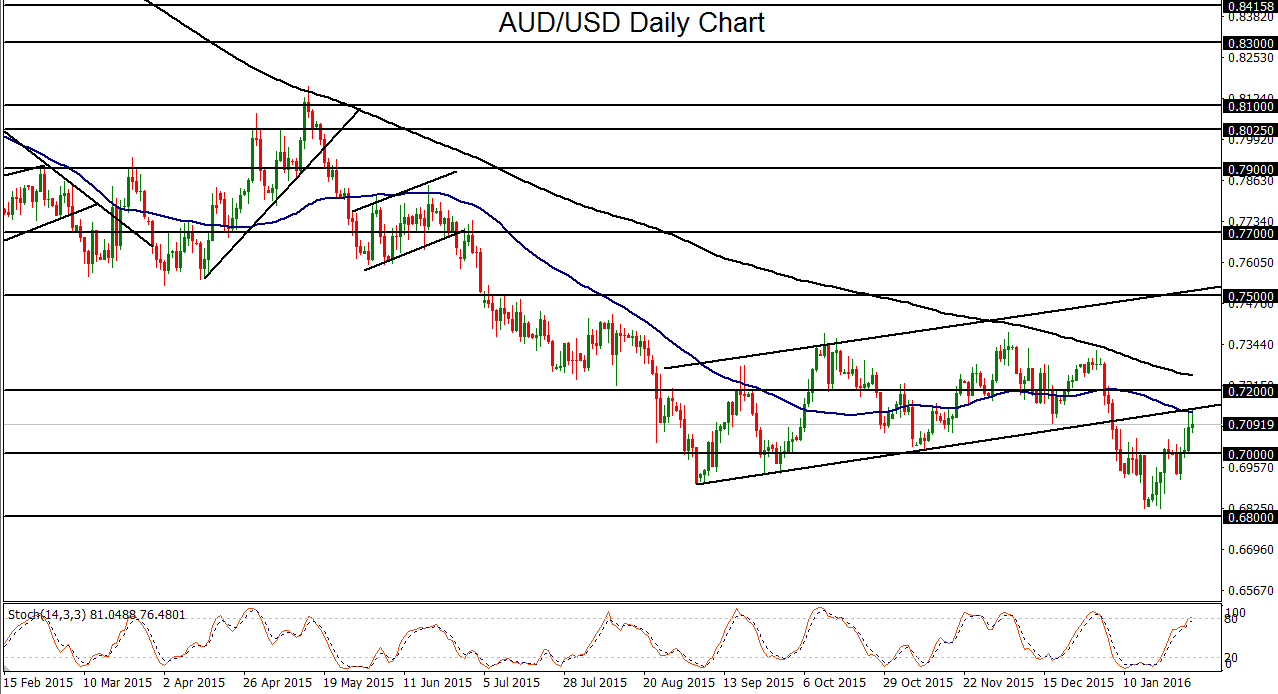
AUD/USD
AUD/USD has spent the past week rising above the key 0.7000 level after having formed a small, inverted head-and-shoulders pattern near its multi-year lows. This bullish head-and-shoulders pattern that has been developing since the beginning of the year has given AUD/USD bulls cause for some optimism that a bottom may have formed for the embattled currency pair as it consolidated near recent long-term lows. Two weeks ago in mid-January, AUD/USD dropped to more than a six-year low at 0.6825, just above its 0.6800 downside support target, forming the “head” of the chart pattern. The breakout of the pattern finally occurred this past week, pushing the currency pair back up to hit its 50-day moving average and the underside of a key rising trend line. The Reserve Bank of Australia (RBA) is scheduled to release its rate statement on Tuesday of next week. With slightly higher-than-expected inflation readings in Australia recently announced, the chances of a near-future interest rate cut may have been reduced, and the RBA may strike a more hawkish tone that could boost the Australian dollar further from its long-term lows. In the event that the breakout above the inverted head-and-shoulders pattern is sustained, the next major upside target is around the 0.7200 resistance level. The chart pattern would be invalidated, however, on any return back down below the noted 0.7000 psychological level.
