FX Analysis and Technical Outlook 8211 February 5th 2016
Technical Developments USD/JPY has sharply reversed its recent gains and continues to be vulnerable to a falling dollar and volatility in the equity markets. Technical […]
Technical Developments USD/JPY has sharply reversed its recent gains and continues to be vulnerable to a falling dollar and volatility in the equity markets. Technical […]
Technical Developments
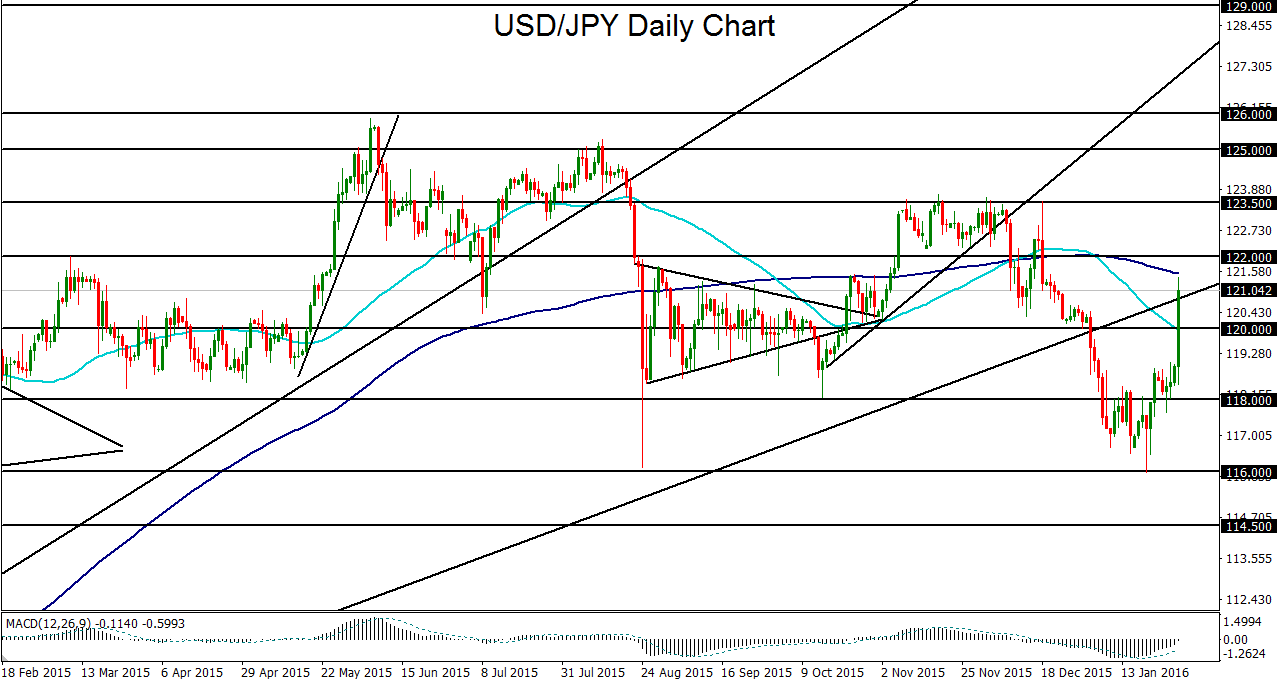
USD/JPY
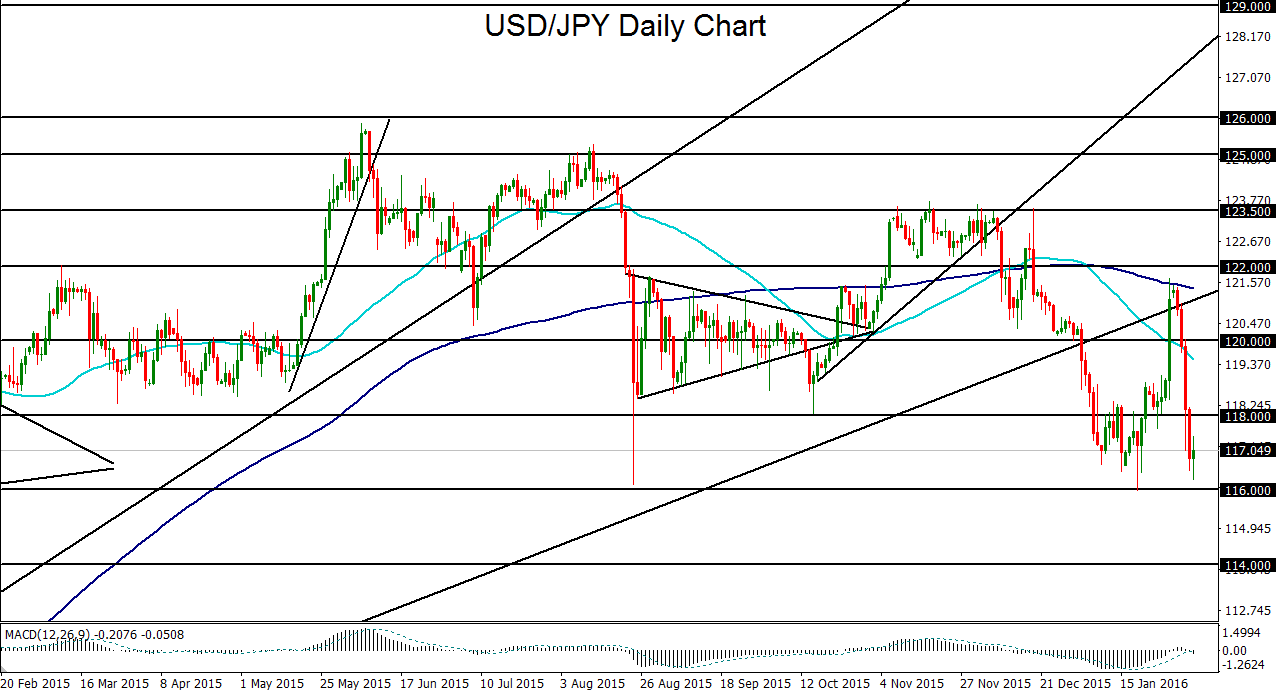
During much of the past week, the US dollar suffered some of its worst losses in years. This was largely due to sharply diminished expectations of further Fed rate hikes this year, as lackluster economic data and highly volatile financial markets have begun to weigh heavily on the Federal Reserve’s interest rate aims. Friday’s non-farm payrolls report for January came out much lower than expected at 151,000 jobs added against prior expectations of 190,000, though the unemployment rate dipped down to 4.9% and average hourly earnings grew by more than expected. The dollar rebounded on this report due to the positives in unemployment and wage growth, despite the sizable miss in non-farm payrolls. For USD/JPY, this past week’s plunge in the US dollar and increased volatility in the stock markets prompted the currency pair to reverse all of its gains from the prior week, when the Bank of Japan cut interest rates into negative territory. This USD/JPY reversal has been both swift and severe, bringing the currency pair back down to re-approach major support around the 116.00 level. Despite the Bank of Japan’s negative interest rate move, lowered Fed hike expectations and heightened stock market volatility have lately appeared to be the main drivers of USD/JPY movement, pushing its exchange rate down towards the lows of its recent trading range. With further dollar weakness, any breakdown below the 116.00 level could begin to target key support around 114.00. Upside resistance after the recent plunge currently resides around the 118.00 level.
GBP/USD
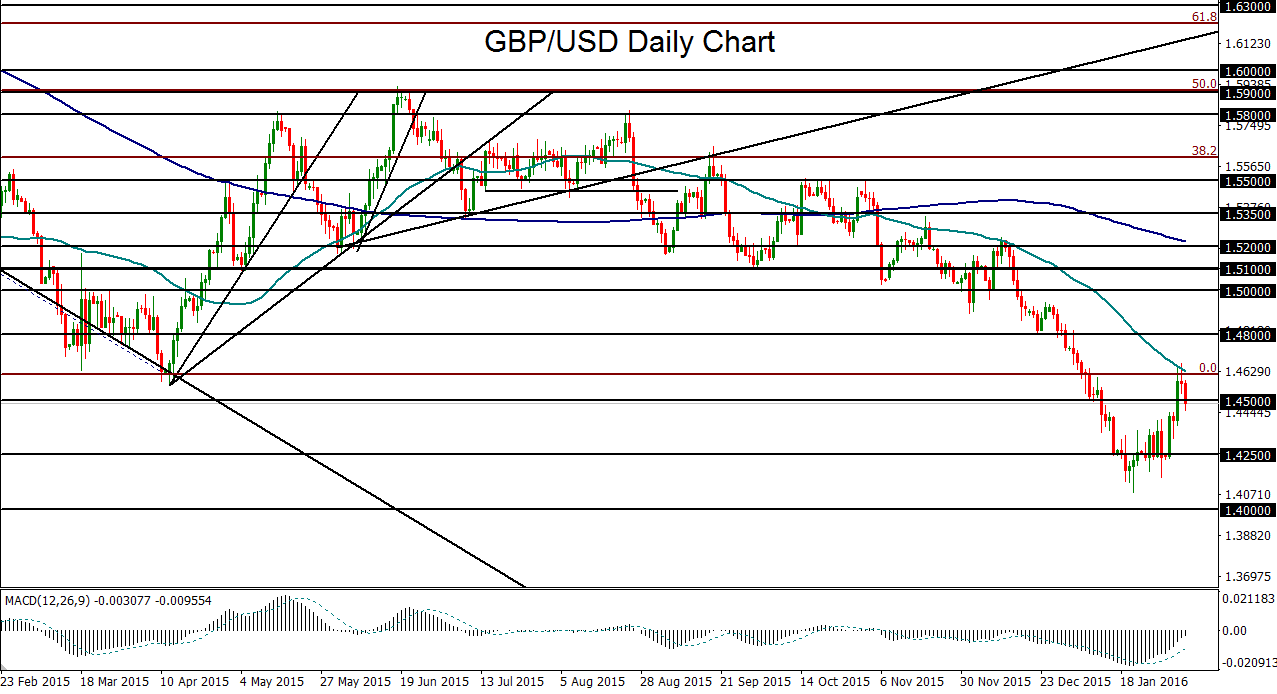
GBP/USD has spent much of the past week rising and continuing its upside pullback within the context of its longer-term downtrend. This rally pushed the currency pair back up to hit key resistance around the 1.4600 level, which is also near where the 50-day moving average is currently situated. After Friday’s US employment data, a dollar rebound prompted GBP/USD to fall from resistance. Could this retreat signal an impending end to the currency pair’s recent upside pullback? With any further downside momentum and sustained trading below the 1.4500 level, a continuation of GBP/USD’s entrenched bearish momentum could prompt a further drop to begin targeting the 1.4250 and then 1.4000 support objectives once again.
USD/CAD
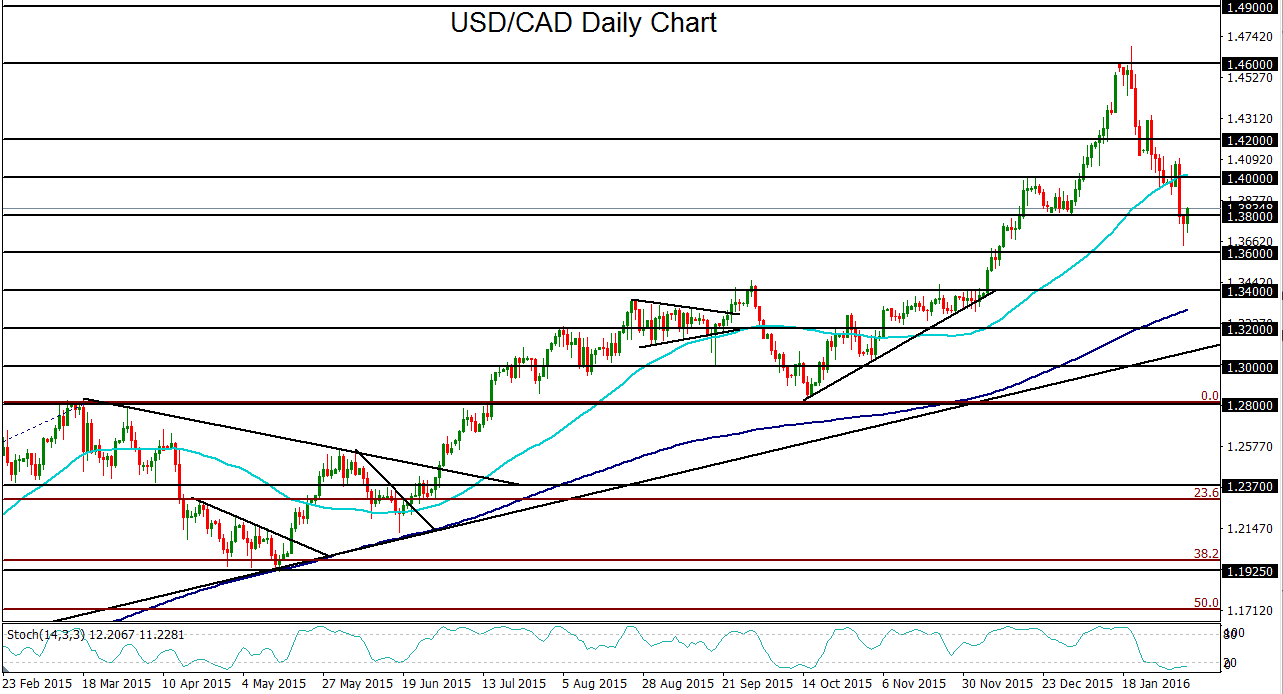
USD/CAD has been in a general decline for the past few weeks as the US dollar has stumbled and crude oil prices have shown slightly more stability on lingering hopes that a deal to cut crude output by major oil-producing nations might at least be in the very preliminary stages. The pullback for USD/CAD has now extended for nearly three weeks, pushing the previously surging currency pair down to seven-week lows below 1.3800 support. Whether this pullback continues or reverses hinges largely on both the market’s ever-shifting view of future Fed rate hikes as well as the rather remote possibility for a crude oil output deal. Any further US dollar weakness should also give a boost to crude oil, whether or not an output deal is reached. In the event of this further weakness in the US dollar, USD/CAD could continue its pullback if it sustains trading below the noted 1.3800 level. In this case, major downside support resides around the 1.3400 level. On any USD/CAD rebound, especially if crude oil continues its entrenched bearish trend, a major upside resistance objective continues to reside around the 1.4000 psychological level.
AUD/USD
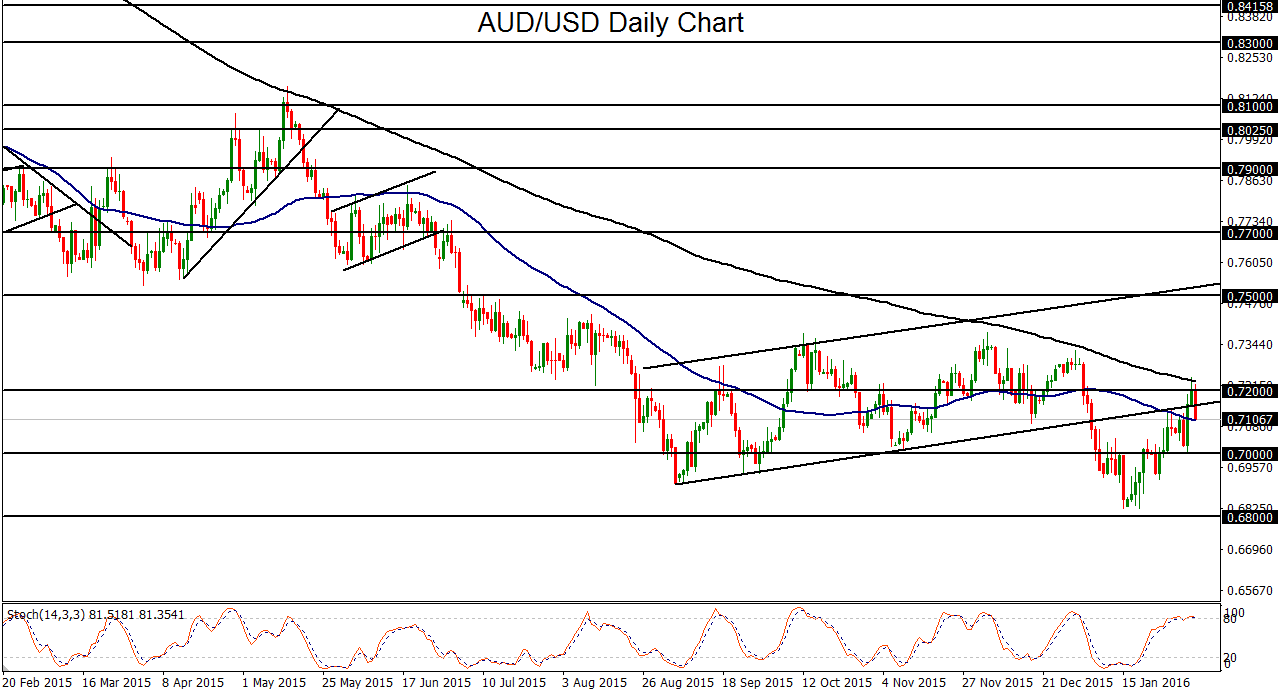
AUD/USD has continued its rebound from multi-year lows, having just reached up to the key 0.7200 resistance level and the 200-day moving average before retreating after the US employment data was released on Friday. Prior to the current rebound, AUD/USD had formed a small, inverted head-and-shoulders pattern near its multi-year lows. This bullish head-and-shoulders pattern that had been developing since the beginning of the year has given AUD/USD bulls cause for some optimism that a bottom may have formed for the embattled currency pair as it consolidated near recent long-term lows. Having broken out above the pattern, AUD/USD could be poised for further gains, especially if the US dollar continues to weaken. A breakout above the 0.7200 resistance level and the 200-day moving average could provide the technical impetus for a further recovery. In that event, a key upside target is around the 0.7400 resistance level. This bullish recovery would be invalidated, however, on any return back down below the 0.7000 psychological level.
