FX Analysis and Technical Outlook 8211 February 26th 2016
Technical Developments USD/JPY rallied off a potential double-bottom pattern this past week, but could see further declines on any return of stock market volatility. Technical […]
Technical Developments USD/JPY rallied off a potential double-bottom pattern this past week, but could see further declines on any return of stock market volatility. Technical […]
Technical Developments
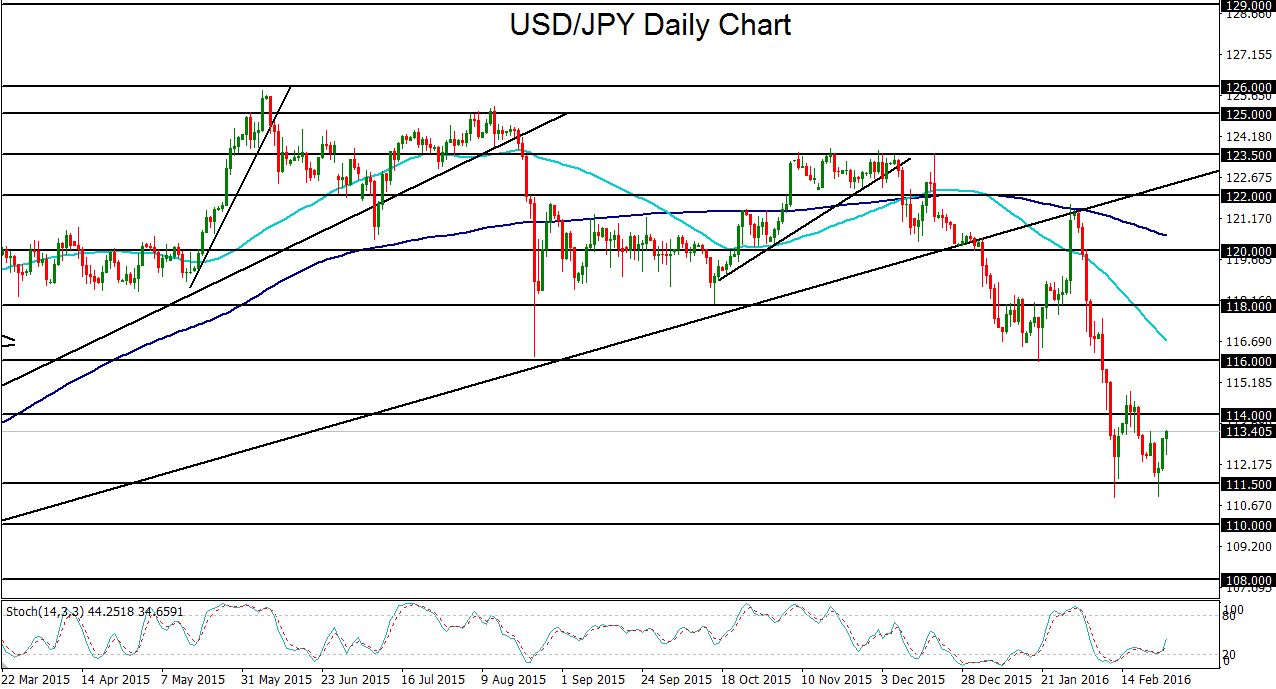
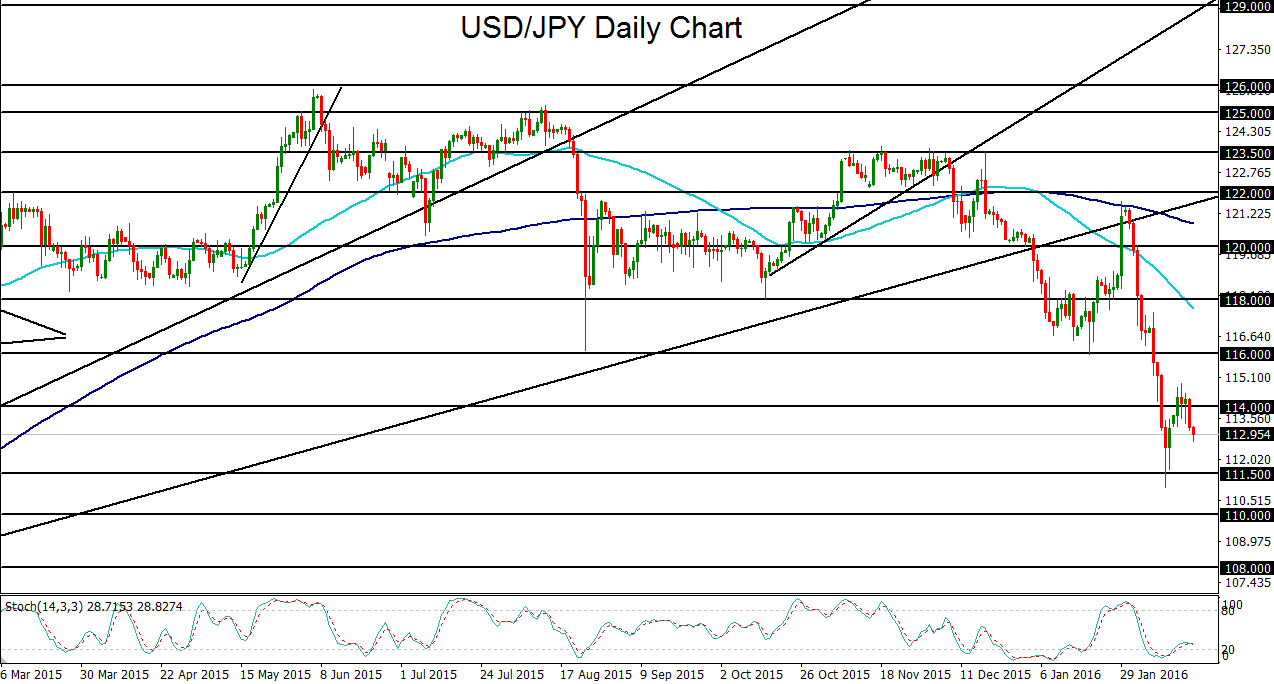
USD/JPY
USD/JPY spent the earlier part of this past week dropping down to hit key support around 111.00, forming a potential double-bottoming pattern in conjunction with an earlier February low. During the latter part of the week, however, the currency pair rebounded as crude oil and global equity markets staged a comeback. Prior to this relative stabilization, global stock market volatility had become the norm since the beginning of the year, prompting precipitous declines for the equity-correlated USD/JPY, especially since the beginning of February when the US dollar depreciated substantially. Those declines culminated in an early February low slightly below 111.00, before a relief rebound occurred that tracked steadying equity markets. This past week, as noted, the currency pair once again plunged to hit a low around the 111.00 level as crude oil uncertainty resumed its grip on global stock markets. This re-test of 111.00 created a potential double-bottom chart pattern that may have presaged at least a temporary bottoming of USD/JPY. Possibly supporting this view is the ever-present potential for a currency intervention by the Bank of Japan, with the aim of curbing unwanted appreciation of the yen. With regard to this, two unknowns persistently remain: 1) around what level would the Bank of Japan intervene? And 2) would intervention really have any lasting impact on keeping the Japanese currency down in the face of continuing market volatility that boosts the safe haven yen? These questions remain to be answered, but what is currently known is that financial markets have sustained a generally fearful environment despite this past week’s rebound, and the recent trend for USD/JPY has been unmistakably to the downside. Therefore, barring any major stock market recovery or drastic Bank of Japan intervention, USD/JPY remains pressured over the short-term. If this continues to be the case, the current double-bottom pattern could simply be a moment of respite within a continuing slide. Provided the currency pair sustains trading below the 114.00 resistance level, any breakdown below the noted 111.00-area lows would confirm a continuation of the downtrend. In that event, the next major targets to the downside reside at the 110.00 and then 108.00 support objectives.
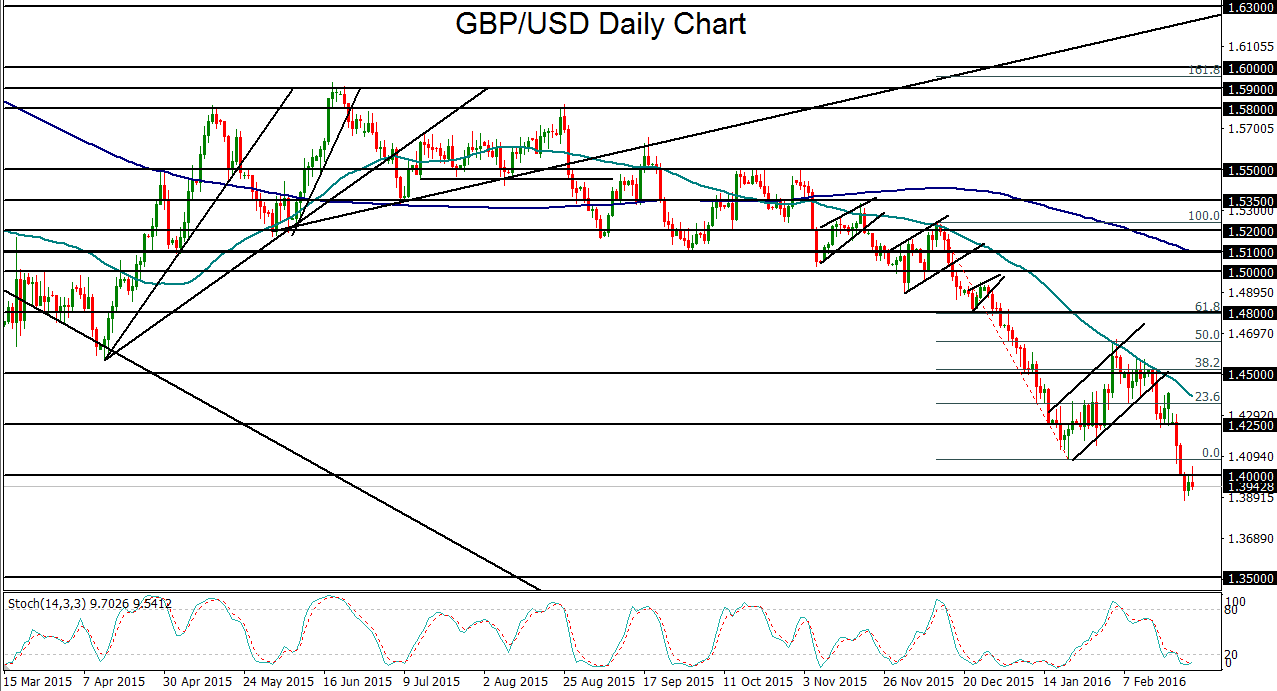
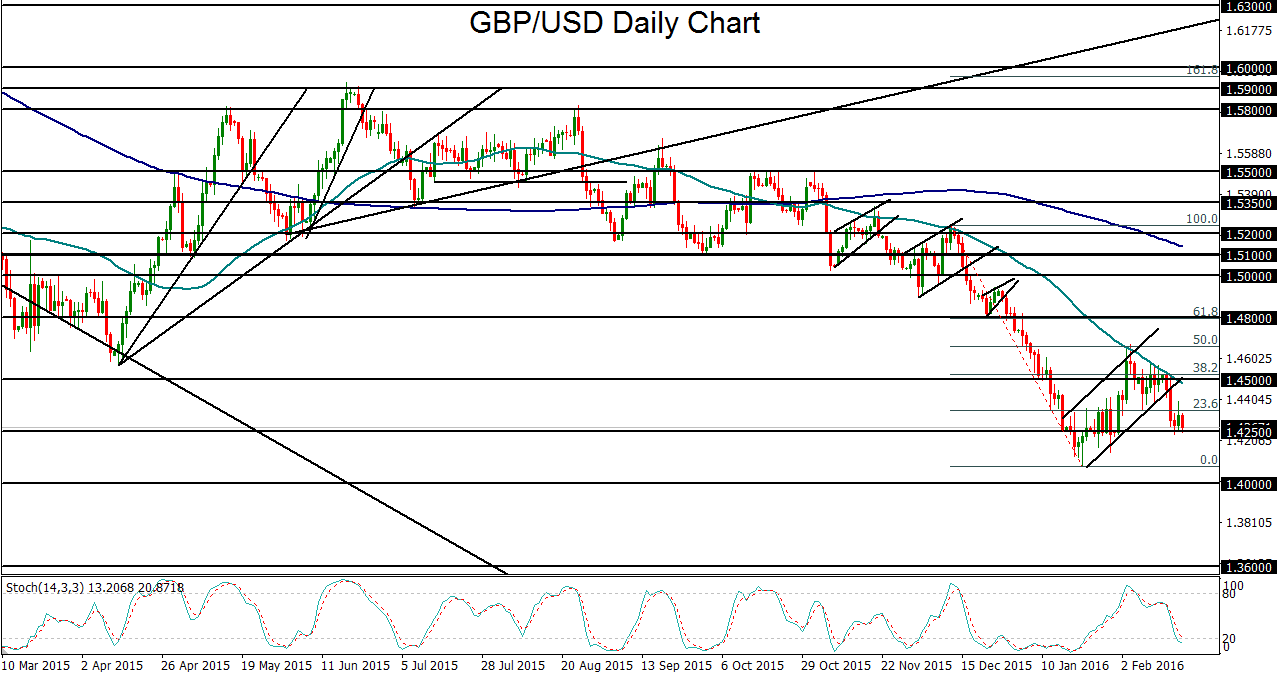
GBP/USD
Early on during the past week, the British pound took center stage as it extended its plunge due to increasing fears over the ramifications of a potential UK exit from the European Union, or “Brexit.” Sterling fell against the dollar, euro, yen, and others, to further extend its losses after British multinational bank, HSBC, issued a stern warning that a Brexit would damage UK economic growth substantially and potentially result in another 20% drop in the pound’s value against the dollar. Though the vote is not scheduled until early summer, speculation over the potentially severe consequences of an actual UK exit of the EU has increasingly weighed on the pound, especially since the June 23rd referendum date to vote on EU membership was confirmed this past week. The extension of GBP/USD’s recent plunge resulted in a breakdown below major support around the psychologically-significant 1.4000 level, establishing nearly a seven-year low under 1.3900 in the process. This confirms a continuation of the longstanding bearish trend for the currency pair. Although GBP/USD is technically oversold after such sharp and prolonged declines recently, and some semblance of a relief rebound may be forthcoming, both the overall fundamental outlook as well as the longer-term price momentum are currently pointing to the downside. Of course, this could change if near-future developments start to indicate a lower likelihood of a Brexit. With GBP/USD having fallen sharply since mid-February, and especially with this past week’s noted breakdown below previous support at 1.4000, the currency pair is currently eyeing a key downside support objective at the 1.3500 level. That support level represents the major long-term low established in the beginning of 2009.
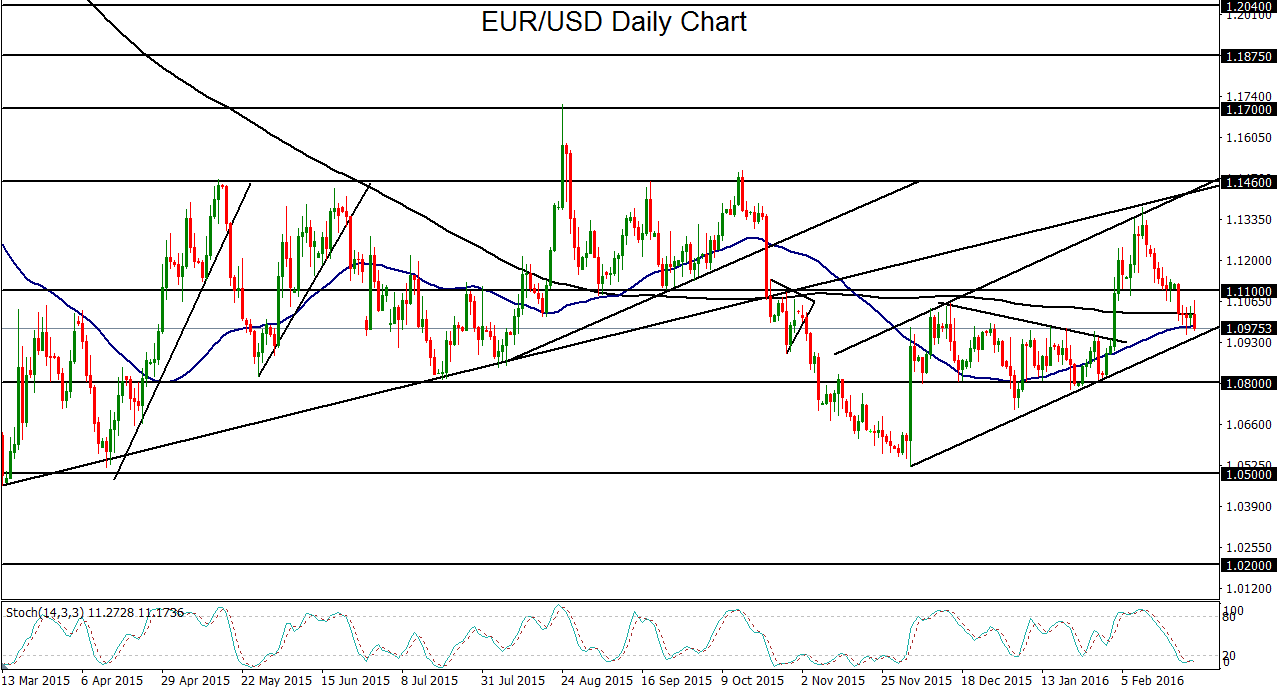
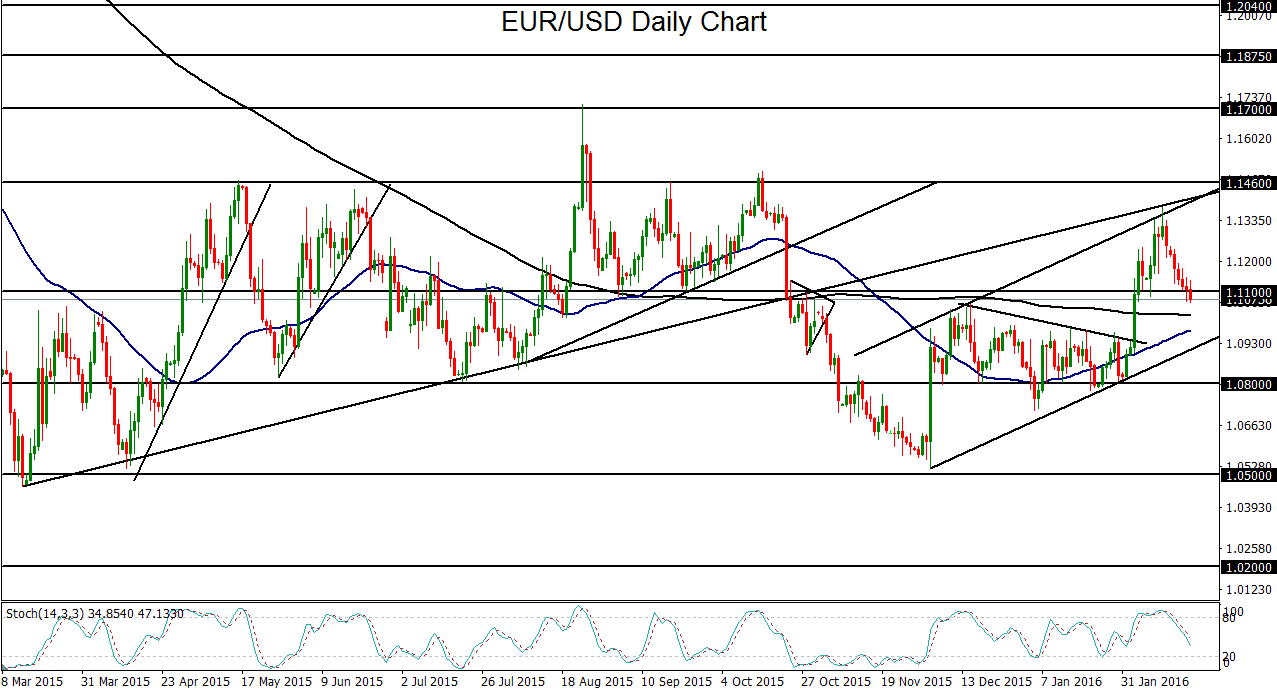
EUR/USD
EUR/USD spent this past week in a continued decline after having dropped sharply since mid-February. By mid-week, the currency pair hit a new three-week low under 1.1000. During the course of this precipitous drop, EUR/USD broke down below previous major support at the 1.1100 level and has fallen back down to a convergence of its 50-day and 200-day moving averages. As of this writing, it has also dropped down to approach a key uptrend support line within a parallel trend channel extending back to early December’s low near 1.0500. The euro has been pressured recently due to several different factors, including the increasing possibility that the European Central Bank (ECB) will soon act to implement additional monetary easing measures. ECB President Mario Draghi recently made comments indicating a strong willingness and readiness to do so. Scheduled early next month is the eagerly awaited ECB Press Conference, which should provide clearer guidance as to what those easing measures may entail. Also pressuring the euro has been the increased threat of deterioration in the European Union, most notably by an upcoming referendum in the UK to vote on whether or not it stays in the EU. A UK exit, or “Brexit,” could not only cause potential damage to the UK and sterling, but also to the remaining members of the EU and the euro. On the US dollar side of the EUR/USD currency pair, extreme doubts earlier in the month with regard to another Federal Reserve rate hike have been mitigated by relatively positive domestic economic data as of late, including Friday’s positive surprise in fourth-quarter US GDP growth. Scheduled for late next week are the US Non-Farm Employment Change, Average Hourly Earnings, and Unemployment Rate data for the month of February. As the US employment situation is one of the primary economic indicators taken into consideration by the Fed in setting monetary policy, these data points are typically crucial in reinforcing or changing interest rate expectations as well as the short-term fate of the dollar. With significant negative factors weighing on the euro, and the still-conceivable potential for further Fed tightening providing some support for the dollar, EUR/USD could continue its recent downward trajectory to align with its long-term bearish trend. From a technical perspective, as long as EUR/USD continues to trade below the noted 1.1100 level, which has now become resistance, the stage could be set for a breakdown below the current parallel uptrend channel. In the event of such a breakdown, the next major target is at the 1.0800 support level, followed further to the downside by the key 1.0500 support objective.
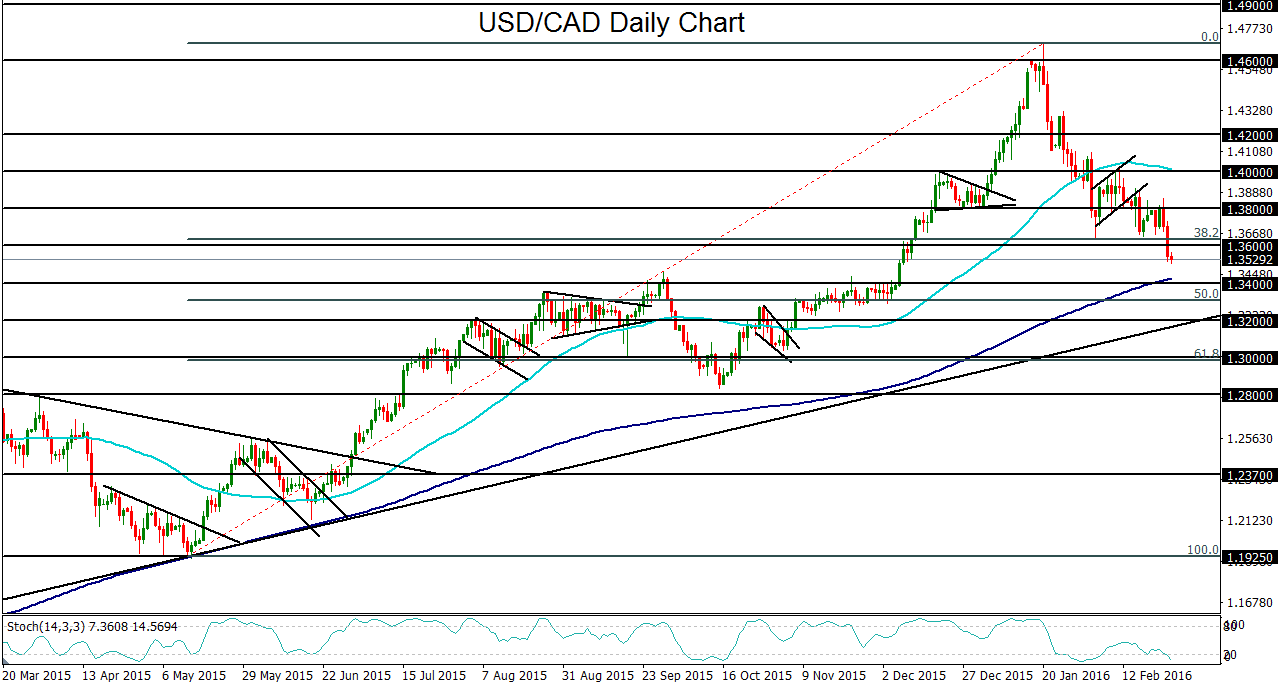
USD/CAD
USD/CAD spent this past week mostly in decline as crude oil markets were lifted by more substantive talk regarding a proposed OPEC/non-OPEC crude production cap at January’s output levels. Crude oil was also boosted by an International Energy Agency (IEA) report that projected US shale oil production to decrease substantially within the next two years. Specifically, the IEA expects to see shale production in the US decrease by 600,000 barrels per day in 2016 and by 200,000 additional barrels per day in 2017. Despite the Saudi oil minister asserting this past week that major oil-producing countries would not actually be seeking to cut output, crude oil was able to rally during the latter half of the week as speculators saw these recent developments as a potential start to alleviating the persistent oil oversupply situation. With this crude rally, the Canadian dollar was also pushed higher due to its close correlation with oil prices. This pressured the USD/CAD currency pair to break down below key support around the 1.3600 level towards the latter part of the week. This breakdown also prompted a drop below the 38% Fibonacci retracement of the bullish trend that runs from the 1.1900-area lows in May of last year all the way up to the 12-year high above 1.4600 in January. While a further recovery in crude oil prices is far from assured, a continued short-term bounce on hopes for a coordinated deal to cap output is certainly possible. In this event, with any sustained trading for USD/CAD below the noted 1.3600 level, the next major downside support target resides around the key 1.3400 level.
