FX Analysis and Technical Outlook 8211 December
Key Economic Data Releases Next Week Tuesday (8 Dec): – AUD – NAB Business Confidence – CNY – China Trade Balance – JPY – Bank […]
Key Economic Data Releases Next Week Tuesday (8 Dec): – AUD – NAB Business Confidence – CNY – China Trade Balance – JPY – Bank […]
Key Economic Data Releases Next Week
Tuesday (8 Dec):
- AUD – NAB Business Confidence
- CNY – China Trade Balance
- JPY – Bank of Japan Governor Kuroda Speech
- GBP – UK Manufacturing Production
- CAD – Canada Building Permits
- CAD – Bank of Canada Governor Poloz Speech
Wednesday (9 Dec):
- CNY – China Consumer Price Index
- CAD – US Crude Oil Inventories
Thursday (10 Dec):
- NZD – RBNZ Official Cash Rate
- NZD – RBNZ Rate Statement
- NZD – RBNZ Monetary Policy Statement
- NZD – RBNZ Press Conference
- AUD – Australia Employment Change
- AUD – Australia Unemployment Rate
- CHF – Libor Rate
- CHF – Swiss National Bank Monetary Policy Assessment
- CHF – Swiss National Bank Press Conference
- GBP – UK Trade Balance
- GBP – Bank of England MPC Official Bank Rate Votes
- GBP – Bank of England Monetary Policy Summary
- GBP – Bank of England Official Bank Rate
- USD – US Unemployment Claims
Friday (11 Dec):
- AUD – Australia Mid-Year Economic and Fiscal Outlook
- EUR – European Central Bank Targeted LTRO
- USD – US Core Retail Sales
- USD – US Producer Price Index
- USD – US Retail Sales
- USD – US Core Producer Price Index
- USD – Preliminary University of Michigan Consumer Sentiment
Technical Developments
EUR/USD
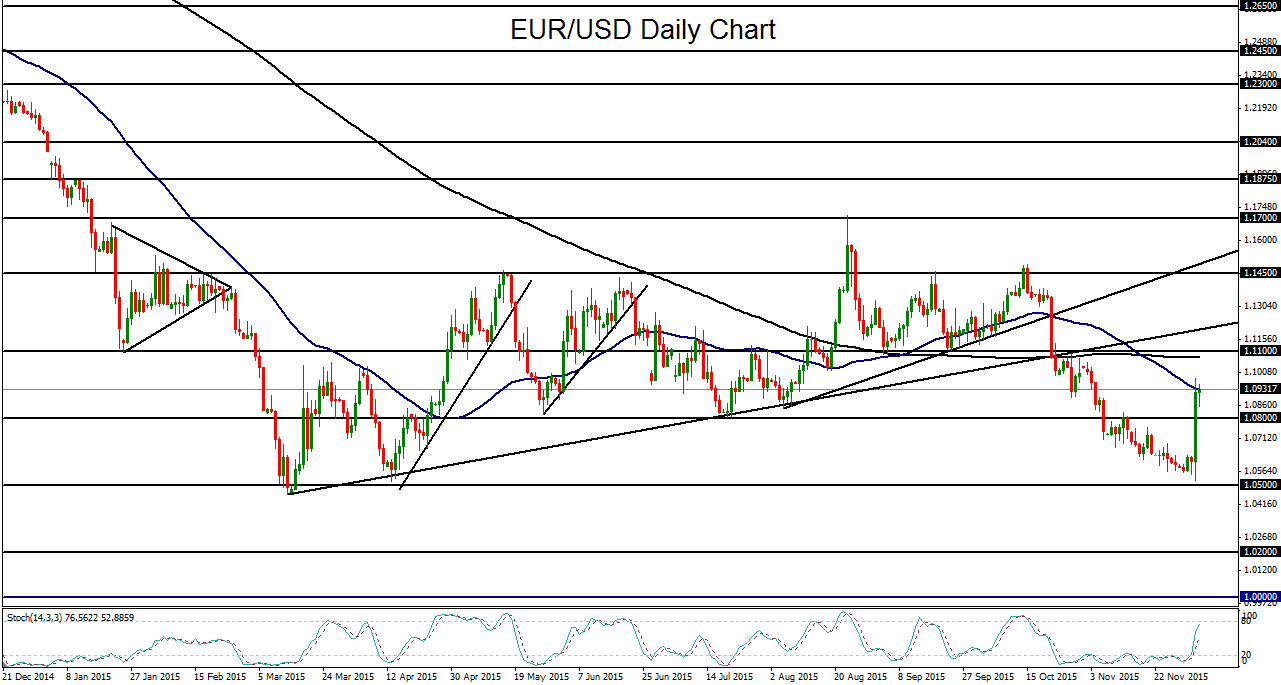
This past week saw EUR/USD surge dramatically on Thursday after the European Central Bank (ECB) failed to impress with a smaller-than-expected deposit rate cut down to -0.30% from -0.20%. This minimal response from the ECB surprised euro bears, who had been expecting more substantial stimulus measures. As a result of this surprise, the euro rose sharply, prompting a plunge for the US dollar that resulted in its largest daily drop in years. The ECB rate decision was followed on Friday by the US Non-Farm Payrolls (NFP) report, which showed a better-than-expected 211,000 jobs added in the US against prior expectations of 201,000. This reading further supports the case for an interest rate hike by the US Federal Reserve in its mid-December meeting, but the data only provided a very modest initial lift and rebound for the US dollar. Prior to Thursday’s ECB announcement, EUR/USD had dropped steadily to approach its downside target of 1.0500. After the ECB, the currency pair rose rapidly above 1.0800 resistance to hit its 50-day moving average. On Friday, immediately after the NFP results, EUR/USD fluctuated around this 50-day moving average, but generally remained strong, maintaining Thursday’s gains. Despite the spike for EUR/USD, a divergence in monetary policy continues to exist between the ECB and Fed. The spike occurred primarily because the market was surprised by the rather tepid actions of the ECB. Therefore, as long as some form of this divergence remains in play, EUR/USD should continue to be pressured over the longer-term. On any further short-term rebound, major resistance resides directly above, around the 200-day moving average and the key 1.1100 resistance level. To the downside, any sustained return below 1.0800 should see a resumption of the bearish bias for EUR/USD, with the key downside target remaining at the noted 1.0500 support level. Longer-term, further downside targets reside at 1.0200 and parity (1.0000).
GBP/USD
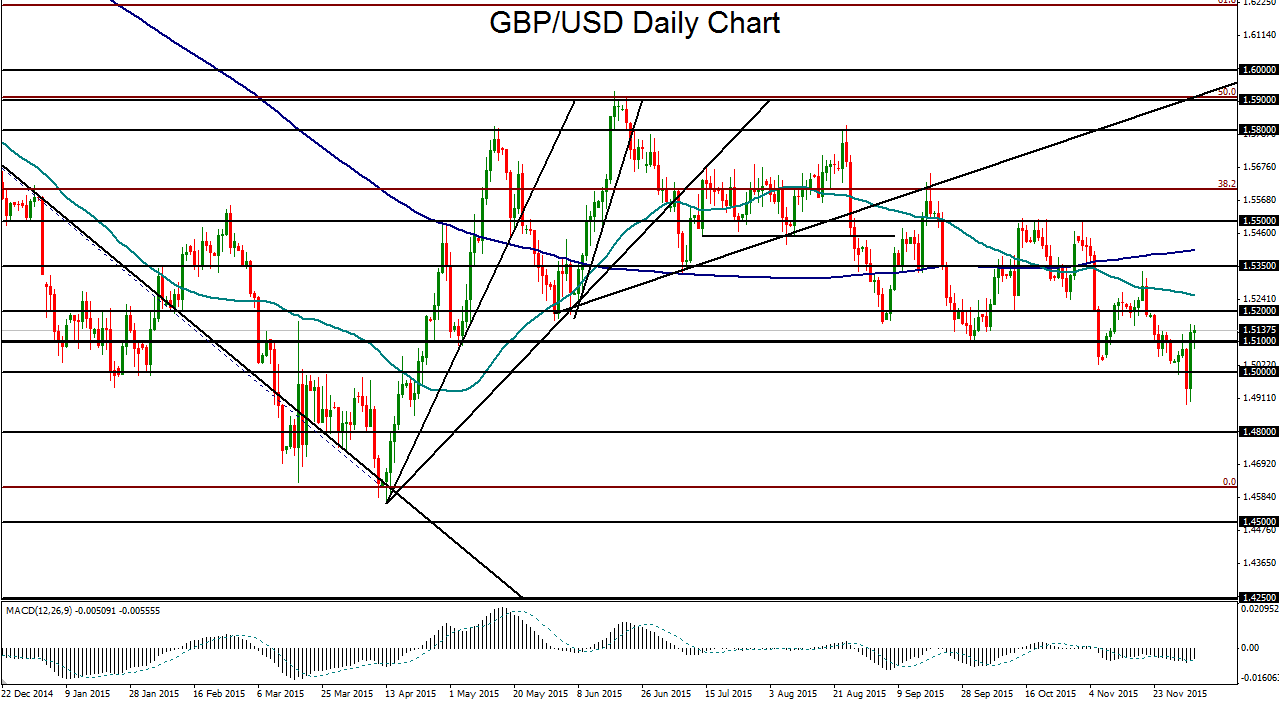
This past week also saw sharp moves for GBP/USD, which fell below 1.5000 earlier in the week but regained strength after Thursday’s ECB-driven plunge in the US dollar. To end the week, the US NFP report on Friday initially led to a modest rebound for the dollar and a pullback for GBP/USD, although those moves were short-lived. Overall, since the mid-June highs around 1.5900 resistance, the currency pair has been following a regular series of lower highs and lower lows. By definition, this places GBP/USD within a clear downtrend that is supported by the anticipated discrepancy with regard to monetary policy tightening between the Bank of England and the Fed. Therefore, despite Thursday’s spike, the directional bias for GBP/USD continues to be bearish in line with this downtrend. With short-term upside resistance around the 1.5200 level, any continuation of the entrenched downtrend below 1.5000 should continue to target downside price objectives at 1.4800 and 1.4600.
USD/JPY
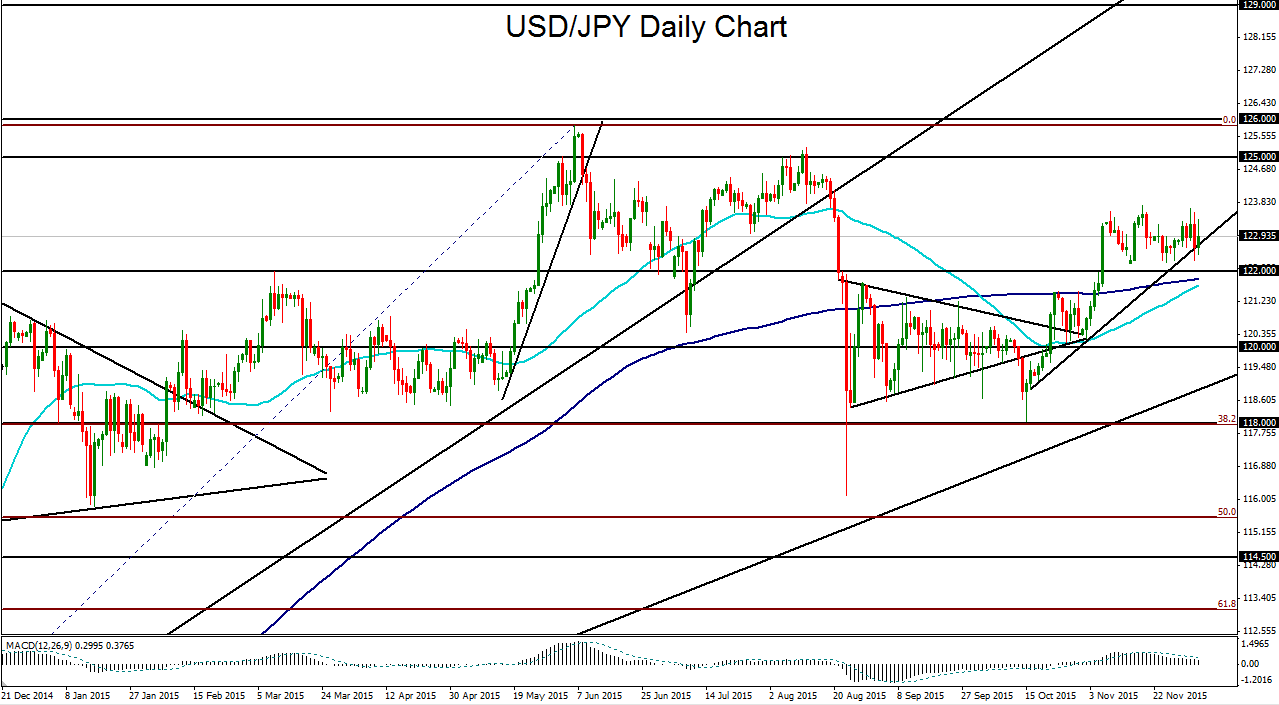
USD/JPY spent this past week in continued consolidation as it fluctuated with the ebbs and flows of the US dollar. Earlier in the week, the currency pair had risen on building anticipation of a US rate hike in mid-December. This rise was substantially interrupted on Thursday, however, by the ECB rate decision and its resulting pressure on the US dollar. Friday’s positive NFP reading prompted a modest rebound that pared some of Thursday’s losses. On a slightly longer-term basis, since mid-October when a clear daily hammer candle spiked down to major support around the key 118.00 level, USD/JPY has rebounded sharply along a strong uptrend line as a Fed rate hike in December increasingly came to be expected. The last NFP report in early November far exceeded expectations, prompting a dramatic breakout above prior resistance at 122.00. Since that breakout, USD/JPY has remained strong, but has essentially traded in a range for the past four weeks. The high of that range in mid-November was around the 123.75 level. In the event of a breakout above this 123.75 range high and a continuation of the recent bullish trend, the next major upside target and a key resistance barrier resides at the 125.00 level, which was last reached in August. In the event of a breakdown below the noted uptrend line that goes back to mid-October, strong support should be found around the noted 122.00 level, which has turned from resistance to support after November’s breakout.
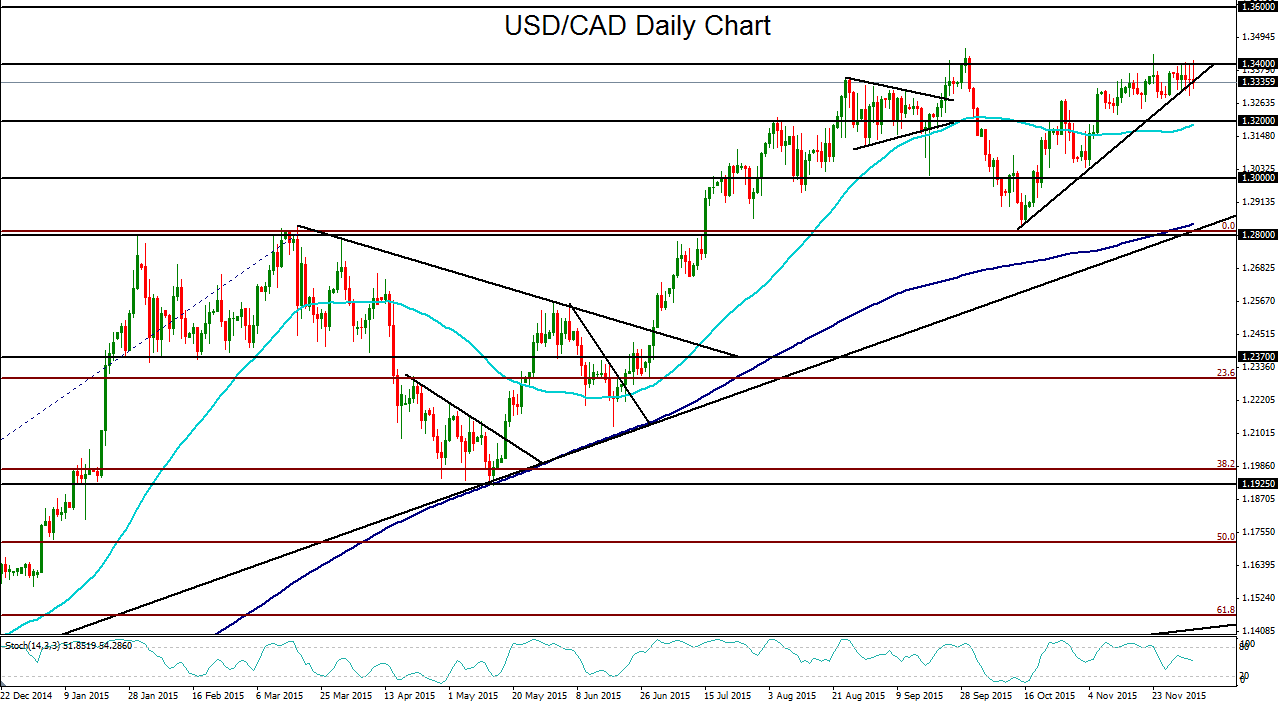
USD/CAD
USD/CAD has continued to stall under key resistance around the 1.3400 area after having made repeated failed attempts at reaching towards September’s 11-year high of 1.3456. Since mid-October, USD/CAD has been entrenched in a clear bullish trend, from the 1.2800-area support lows, that is well-defined by a relatively sharp uptrend support line. This medium-term uptrend lies within the context of a longer-term bullish trend going back at least to July of last year. Both the recent and longstanding bullish momentum for the currency pair can be traced back to several different factors. Weighing on the Canadian dollar has been a dovish Bank of Canada that has cut its key interest rate twice this year. Also contributing to pressuring the Canadian dollar has been persistent weakness in energy prices, particularly crude oil, with the West Texas Intermediate (WTI) benchmark for US crude not too far off from its multi-year lows due to ongoing oversupply issues. Also contributing to USD/CAD’s ongoing rise, of course, has been the surging US dollar that has increasingly been fueled by progressively stronger prospects for an impending rate hike by the US Federal Reserve, with the majority of speculation now focused on a December hike. With any sustained pullback for the currency pair that breaks down below the noted uptrend support line going back to mid-October, the next major target immediately to the downside resides at the 1.3200 level, followed by the key 1.3000 psychological support level. To the upside, if USD/CAD manages to make a sustained rise above the noted September high of 1.3456, a new long-term high would confirm a continuation of the entrenched bullish trend and could then target further resistance around the 1.3600 level.