FX Analysis and Technical Outlook 8211 December 2015
Key Economic Data Releases Next Week Tuesday (22 Dec): – USD – US Final GDP – USD – US Existing Home Sales Wednesday (23 Dec): […]
Key Economic Data Releases Next Week Tuesday (22 Dec): – USD – US Final GDP – USD – US Existing Home Sales Wednesday (23 Dec): […]
Key Economic Data Releases Next Week
Tuesday (22 Dec):
- USD – US Final GDP
- USD – US Existing Home Sales
Wednesday (23 Dec):
- NZD – NZ Trade Balance
- GBP – UK Current Account
- GBP – UK Final GDP
- CAD – Canada Retail Sales and Core Retail Sales
- CAD – Canada GDP
- USD – US Durable Goods Orders and Core Durable Goods Orders
- USD – US New Home Sales
- CAD – US Crude Oil Inventories
Thursday (24 Dec):
- JPY – BOJ Monetary Policy Meeting Minutes
- USD – US Unemployment Claims
* Note: Due to the Christmas holiday next week, economic data releases are limited in number and scope.
Technical Developments
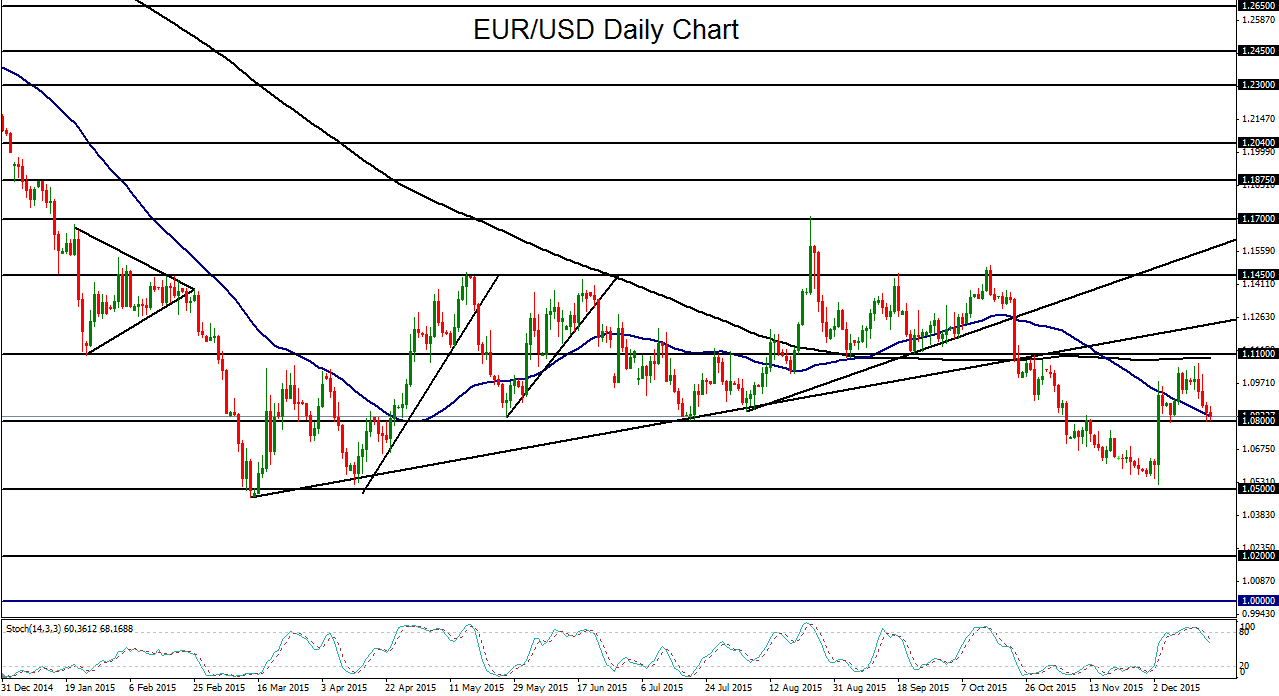
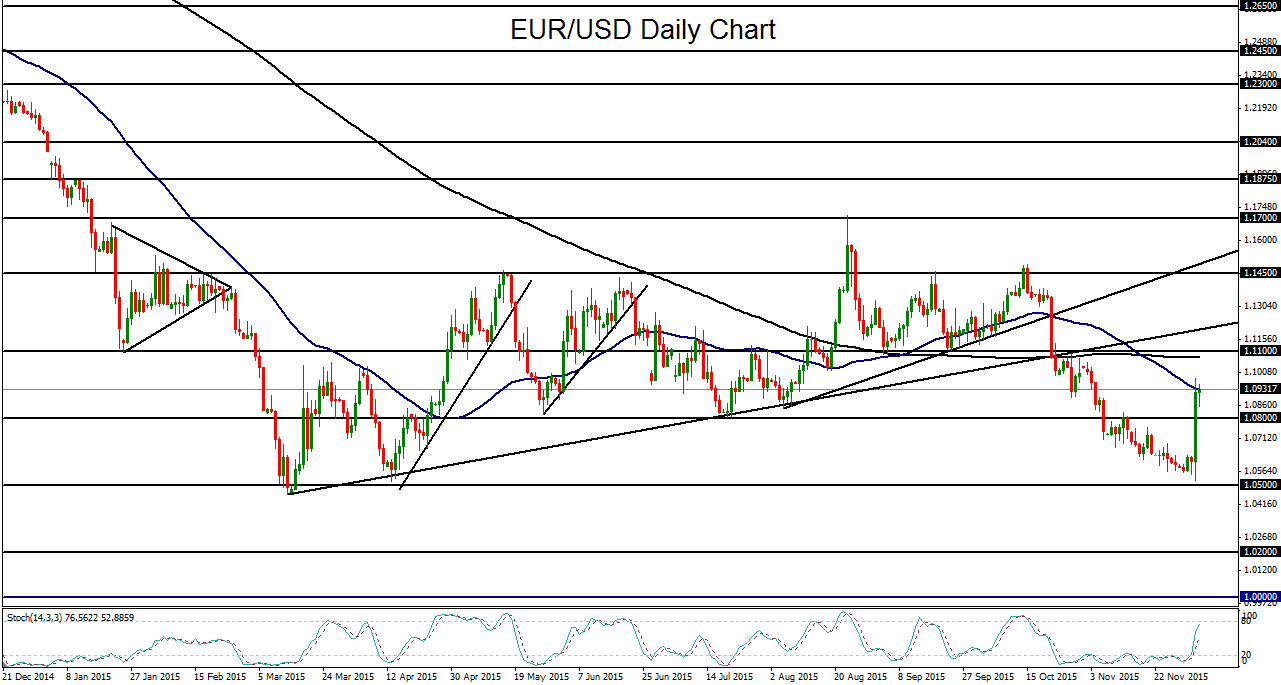
EUR/USD
In the immediate run-up to and aftermath of the US Federal Reserve decision to raise rates by a quarter percentage point this past Wednesday, EUR/USD continued to drop. Most of this past week has been distinctly bearish for the currency pair as it retreated from near major resistance around the key 1.1100 level and 200-day moving average down to hit a major bearish target around the 1.0800 level. Prior to this retreat, the currency pair had been rising in a pre-Fed dollar pullback that had been sparked by weaker-than-expected stimulus measures from the European Central Bank (ECB) in the beginning of the month, prompting a short-squeeze for EUR/USD. This past week’s fall, however pared much of the gains made during that rise. With marked divergence in monetary policy clearly continuing to prevail between the Fed and ECB for the foreseeable future, despite the ECB’s recently weak easing actions, EUR/USD could continue to be pressured towards new lows. In the event of a sustained drop below the noted 1.0800 support level, the next major downside target is at the key 1.0500 support level, which was first established earlier this year when the currency pair formed a rough double-bottoming pattern, and was closely approached in early December before the noted ECB-driven rise. For any further decline below 1.0500, which would essentially confirm a continuation of the long-term bearish trend, further downside targets reside at the 1.0200 support level followed by parity (1.0000).
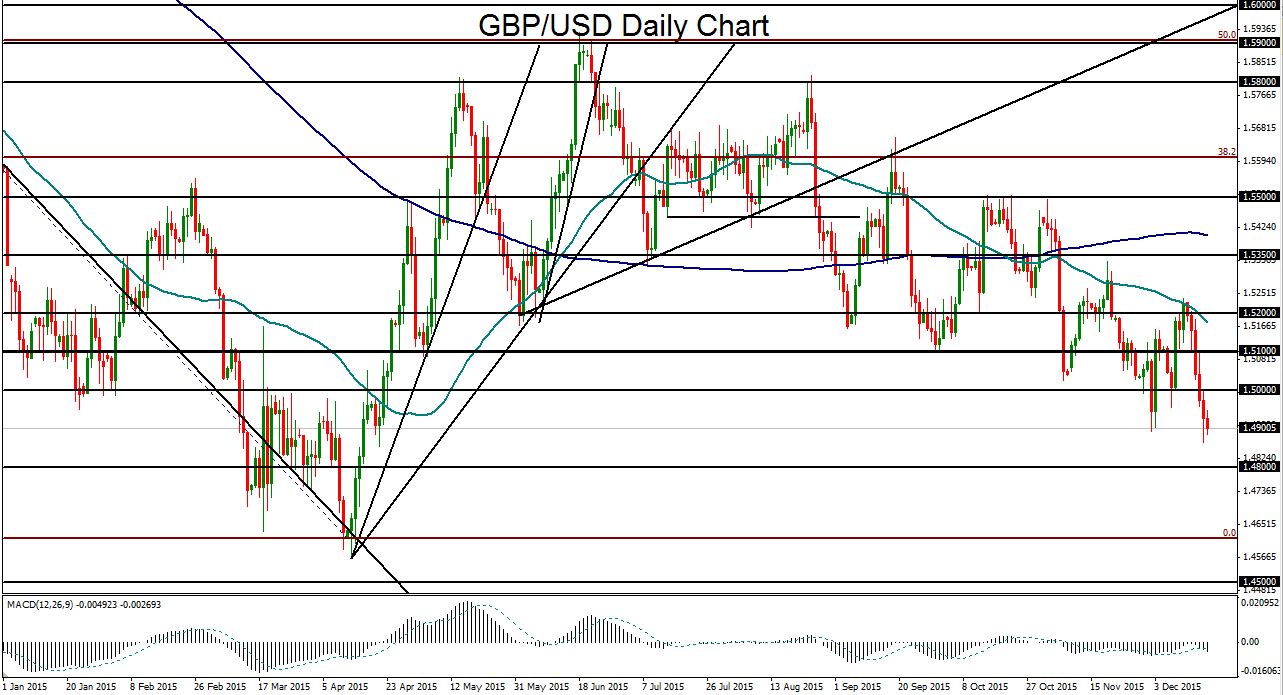
GBP/USD
This past week also saw exceptionally sharp downside moves for GBP/USD, pushing the currency pair down to nearly an eight-month low after the Fed rate hike. Having raised interest rates for the first time in over nine years, with indications of potentially more significant tightening into 2016, the Fed has further established a discrepancy between the beginning of its monetary tightening cycle and that of the Bank of England (BoE). With the BoE not in any hurry to raise interest rates in the UK, this discrepancy could become substantial, potentially placing further pressure on GBP/USD. Since the 1.5900-area high back in mid-June, GBP/USD has formed a series of progressively lower lows and lower highs for the entire latter half of this year, declining within a well-defined bearish trend. With the next major downside target within this bearish trend at the 1.4800 support level immediately to the downside, any further pressure could target the key 1.4600 level, last hit in April, followed by the 1.4250 support area, last hit in mid-2010.
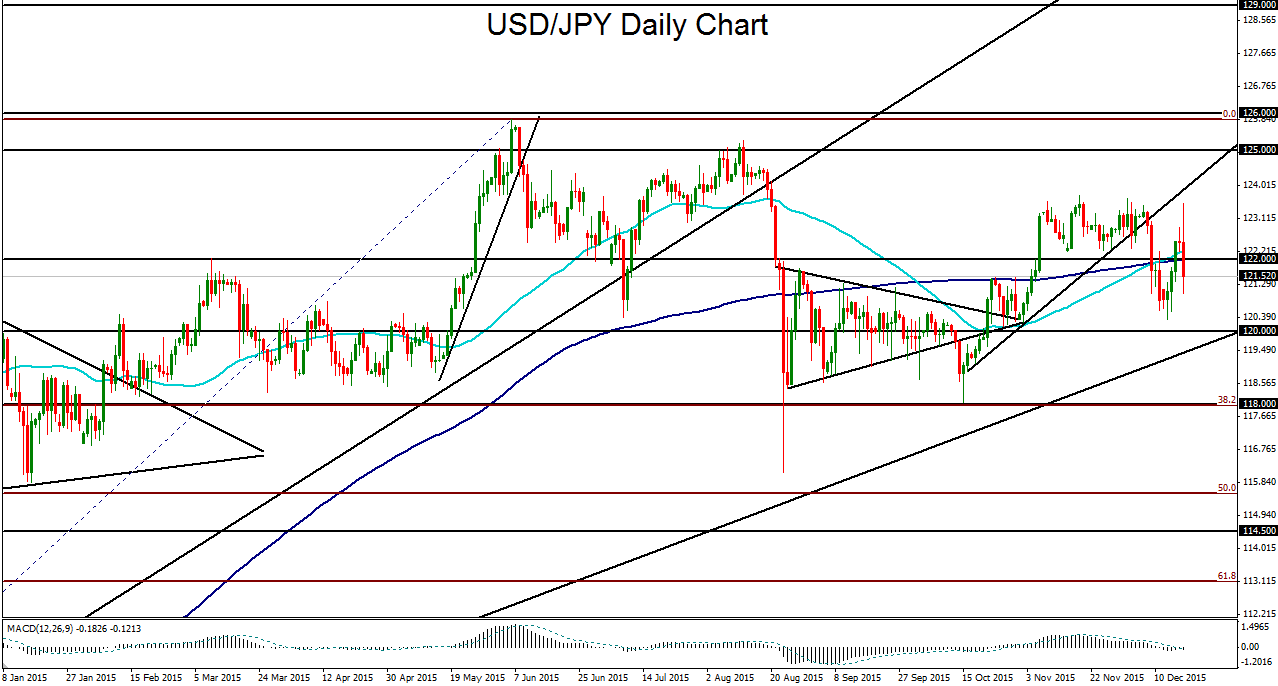
USD/JPY
USD/JPY spent most of this past week rising as the US dollar strengthened. It then gave back much of those gains in volatile trading on Friday, when the yen surged (and USD/JPY dropped) after the Bank of Japan (BoJ) unveiled stimulus measures that disappointed due to their limited scope. Prior to this surprise from the BoJ, the USD/JPY rise pushed the currency pair above the key 122.00 resistance level once again after a somewhat more-hawkish-than-expected Fed announcement boosted the prospects for slightly more pronounced rate increases than had previously been anticipated. Besides that 122.00 level, USD/JPY also broke out above both the 50-day and 200-day moving averages, which had recently made a bullish cross. After Friday’s BoJ-driven drop, however, the currency pair once again fell below those support/resistance levels. Despite this drop, USD/JPY should be able to recover its upside momentum due to the strength of the US dollar as well as the continuing divergent monetary policies between the Fed and BoJ. In this event, the currency pair could see a rally back up towards 123.75 resistance, last tested throughout November and early December, followed by the major bullish resistance objective at 125.00. Key downside support continues to reside around the 120.00 psychological level.
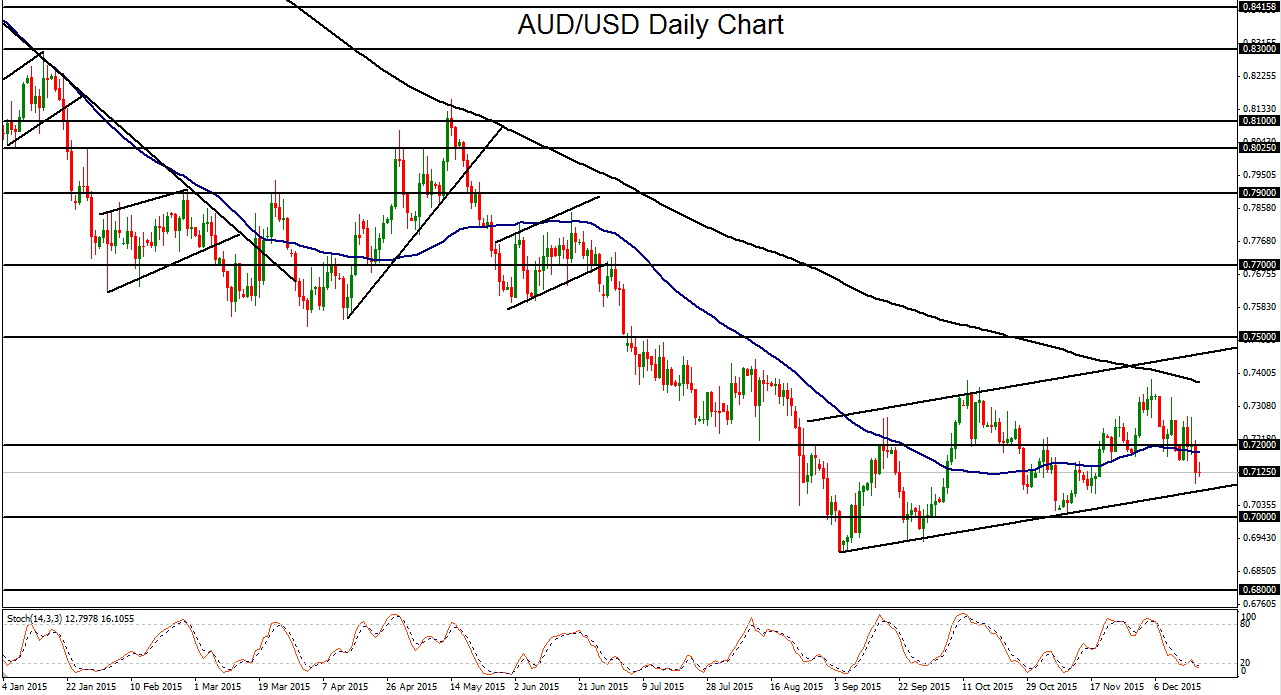
AUD/USD
AUD/USD spent the past week generally in consolidation, but fell on Thursday as the US dollar surged in response to Wednesday’s Fed rate hike. The rate hike itself had been widely-expected and largely priced-in to the strong US dollar even prior to the Fed’s announcement, but a couple of factors hinting at a slightly more hawkish Fed stance than had been anticipated led to a subsequent rise in the greenback. On the Aussie side, although the Reserve Bank of Australia (RBA) kept rates on hold early this month due to recent positive economic data, especially on the employment front, the central bank has reiterated its capacity for cutting interest rates and easing monetary policy further should persistently weak inflation deem it necessary. Overall, this points to a continued divergence in monetary policy between the Fed and the RBA, which should continue to weigh on AUD/USD. Thursday’s substantial drop brought the currency pair down below its key 50-day moving average to approach the bottom border of a parallel uptrend channel that has been in place since September’s six-year low around 0.6900. On any breakdown below this channel, the next major downside objective resides at the key 0.7000 psychological support level, last approached in early November. With the long-term and short-term trends continuing to point to the downside, AUD/USD could soon see new multi-year lows. Any further decline below 0.7000 could then target key support around the 0.6800 level, which would confirm a continuation of the long-term downtrend.
