


April 13, 2021 3:32 PM
FX 2nd Quarter Outlook: DXY, EUR/USD, GBP/USD, USD/JPY, EUR/GBP
With vaccine rollouts and US stimulus checks in hand, the second quarter is expected to boom. The IMF recently adjusted their 2021 GDP outlook to 6% from 5.5% and recent strong economic data has shown that the recovery in some parts of the world has already begun. Many central banks are less concerned with “transient” near-term inflation and more concerned about employment. They have said they will keep monetary policy accommodative until actual inflation is within their targeted ranges, roughly 1%-3%, which they don’t expect for some time! Do the markets believe them? Or will the markets force them to raise rates sooner than they would like? Could economies grow too fast? These questions will be the main drivers for FX markets during Q2.
US Dollar
With US employment expected to rise possibly by millions over Q2, it would be difficult not to see interest rates rise as well. As such, the US Dollar should rise with them. Technically, the US Dollar Index is at an inflection point. Price is near 92.00, which has acted as both support and resistance over the past year. This level also is the 38.2% Fibonacci retracement from the February 25th lows to the March 31st highs. The 200 Day Moving Average is near 92.28. If price bounces, 93.45 is strong resistance, which is the March 31st highs, as well as a long-term upward sloping trendline dating back to 2011! Above there, and price is within range to meet its flag pattern target, as well as, the descending wedge target (from early November to January 6th), which is near 94.25. Support is at the flag lows near 91.30 and the 61.8% Fibonacci retracement of the previously mentioned timeframe, near 91.11.
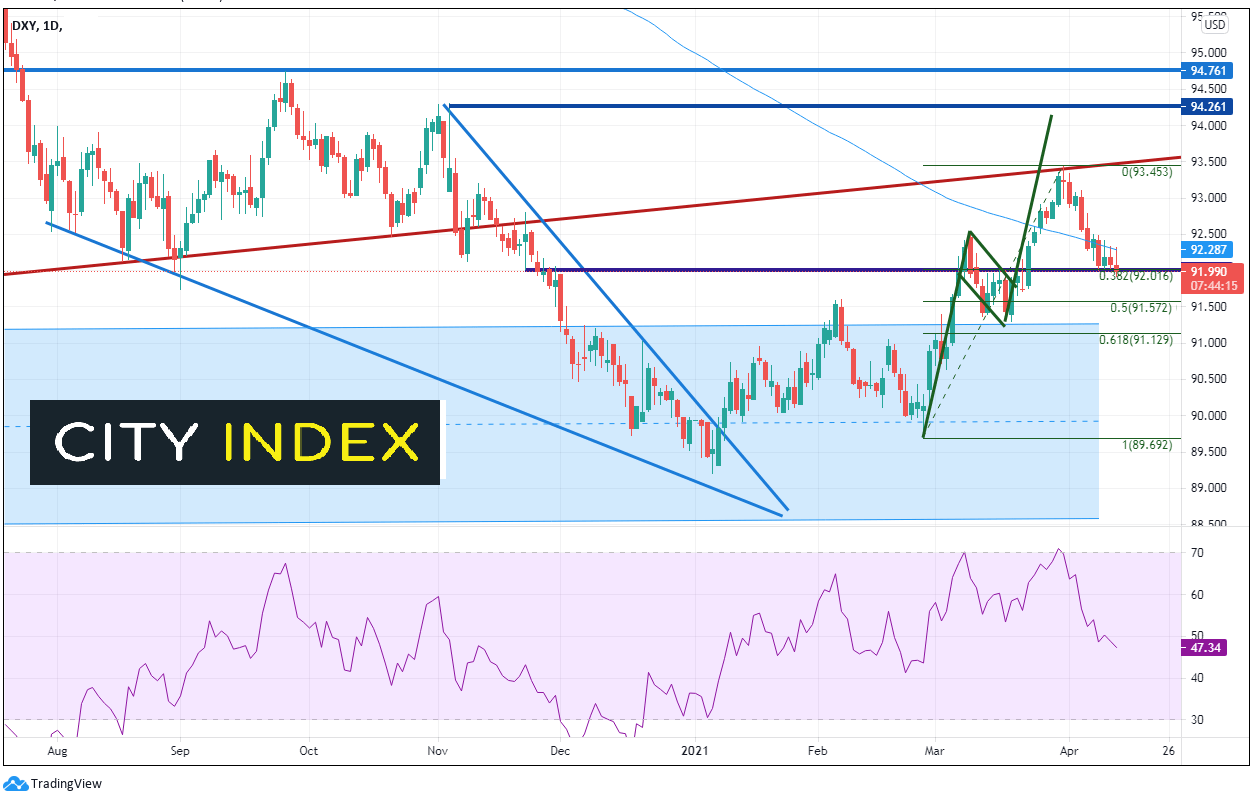
Source: Tradingview City Index
Everything you need to know about the Federal Reserve
EUR/USD
Europe has struggled with containing the spread of the coronavirus and rolling out vaccines. As a result, some European countries are under lockdown or heavy restrictions. The ECB has announced they will continue to be accommodative and they EU has passed a 750 billion Euro recovery plan. The timing of implementation is still a bit uncertain. However, as the vaccines rollout and coronavirus cases begin to fall, the Euro will play “catch up” to the US Dollar as the European economy outperforms that of the US (and other countries as well). Horizontal resistance in the EUR/USD is at the 50% retracement level from the February 25th highs to the March 31st lows near 1.1970, then recent highs of 1.1989. The 61.8% Fibonacci retracement level from the same timeframe is near 1.2032. Support is at the recent low of 1.1892, then the March 31st lows near 1.1708. The next level of support is the November 4th lows near 1.1603.
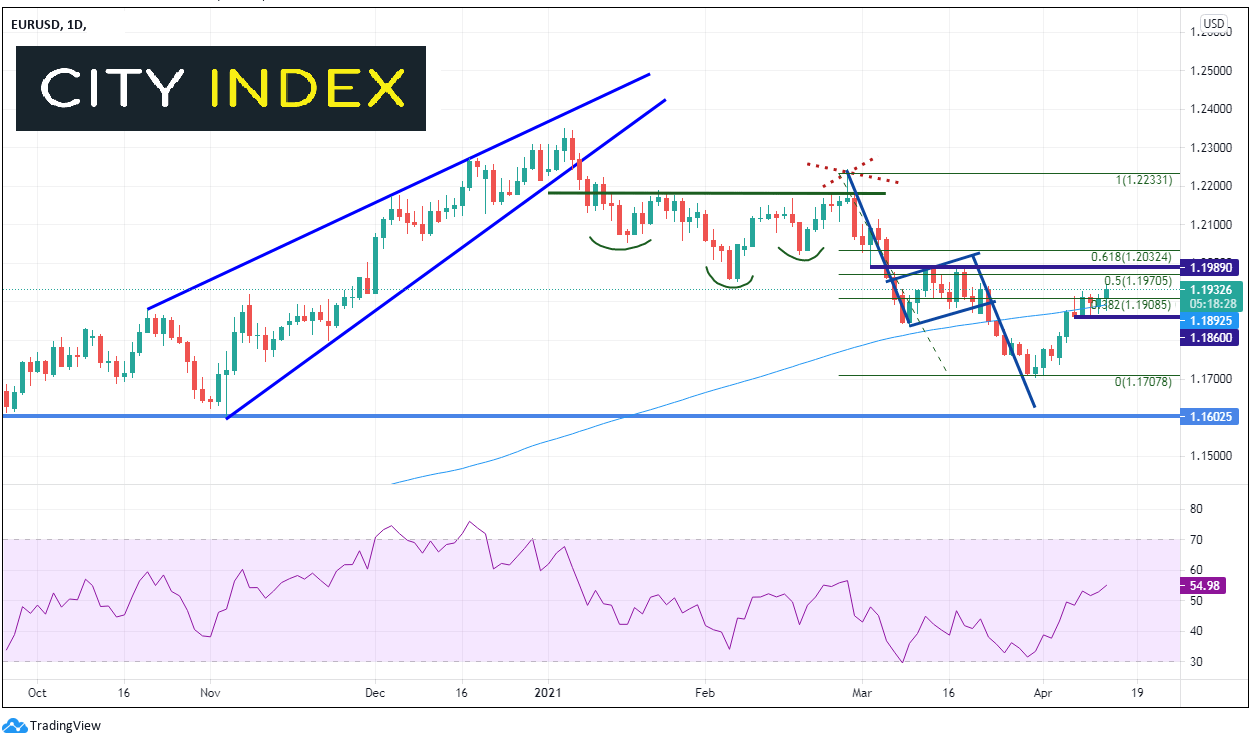
Source: Tradingview City Index
GBP/USD
The UK is on its way back! After the seemingly endless winter days in lockdown, the UK is in the re-opening process. Strong spending and employment should soon begin flowing through to the economic data as the economy recovers. After talking about negative rates earlier in the year, BOE Governor Bailey has changed his tune slightly, however the central bank is more than willing to provide additional stimulus if needed. GBP/USD was in an upward trend since mid-September as traders began pricing in the possibility of a Brexit deal. However, the pair could only remain above 1.4000 for 3 days, as the pair put in a shooting star on the highs of 1.4237 on February 24th. The pair is pulling back in corrective fashion, as it nears the apex of a descending wedge and the 38.2% Fibonacci retracement level from the September 23rd, 2020 lows to the February 24th highs near 1.3650. If price holds, watch for GBP/USD to move towards the descending wedge target at 1.4237. Horizontal support is below at 1.3555 and the 50% retracement level from the previously mentioned timeframe near 1.3450.
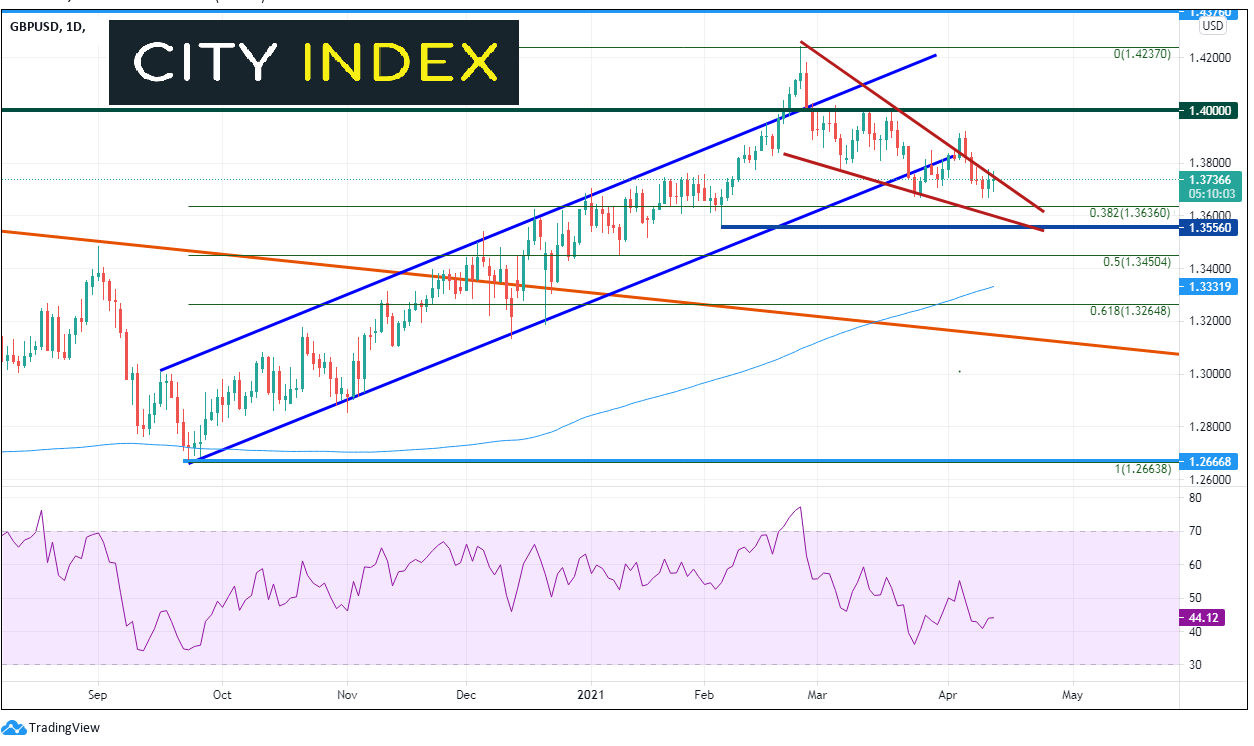
Source: Tradingview City Index
Everything you need to know about the Bank of England
USD/JPY
Japan did well with controlling the coronavirus last year, however, they still had to deal with slowdowns and delays from the rest of the world. As a result, the BOJ became even more accommodative (if that’s possible) than before. Since then, the country has imposed various State’s of Emergency throughout the country which has led to slowdowns. The area everyone has their eyes on is Tokyo, which currently is not under State of Emergency, but is under restrictions. The Olympics are a little more than 3 months away. Although Japan will not allow international spectators, the world will be watching to see if they can keep the coronavirus at bay. Since early March, USD/JPY has been positively correlated with the DXY, with a current correlation coefficient near +0.76. The pair had been moving towards its pennant formation target before correcting, as the RSI was in overbought conditions. USD/JPY is near support at the upward sloping trendline, dating back to late December 2020, as well as the long-term downward sloping trendline (red) dating back to June 2015, near 108.90. Below there, horizontal support is at 108.16. Resistance is that the upper wicks on the daily candles, just below 110 and then the recent highs from March 31st at 110.96.
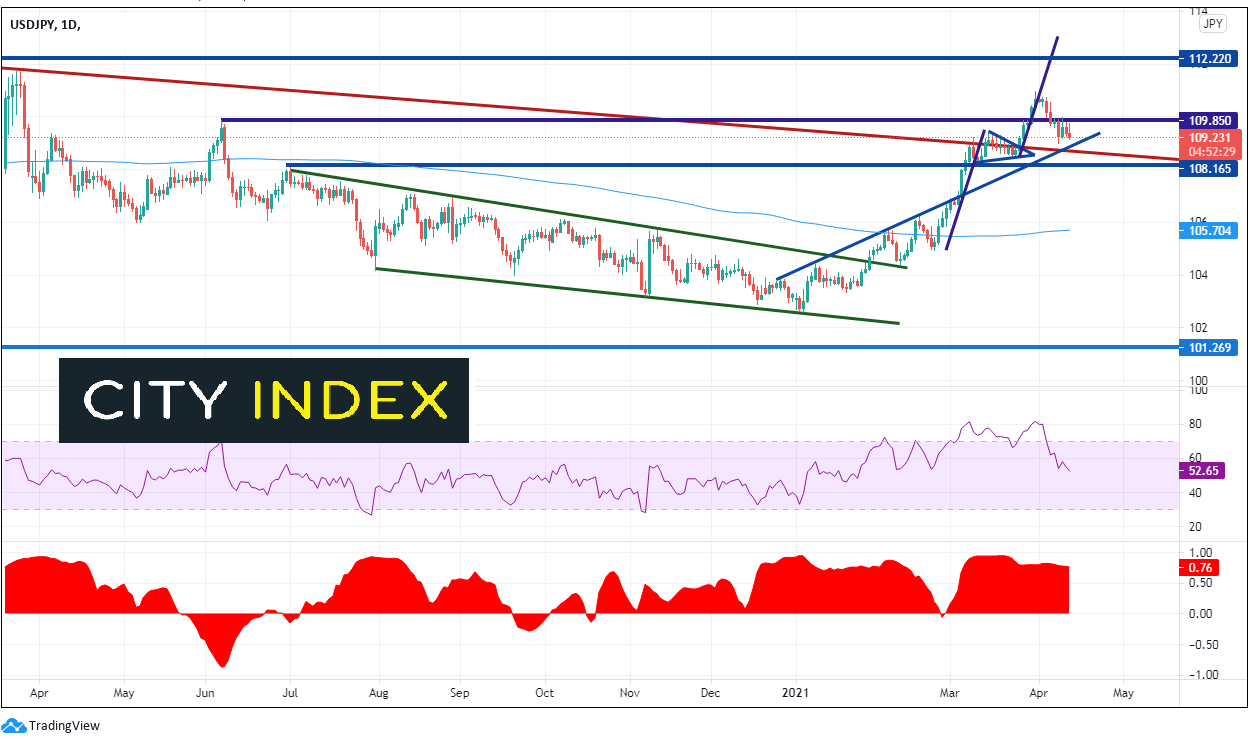
Source: Tradingview City Index
Everything you should know about the Japanese Yen
EUR/GBP
As with the US, Europe will begin playing “catch up” to the UK in terms of a “re-opening”. However, there may be some hiccups along the way as the two sides feel their way through the Brexit deal. The European economy will begin to outperform that of the UK as the lockdowns are lifted and the vaccine rollout gets stronger. Both central banks are committed to accommodative monetary policy as long as needed. EUR/GBP had been moving lower throughout the first quarter, since the Brexit deal was announced. The pair moved from 0.9220 on December 21st, 2020 down to 0.8479 on April 5th! The pair bounced as the RSI diverged with price. In late February, the pair had formed a descending wedge and broke higher out of the wedge on April 7th. The target for the wedge is 0.8731, which is also horizontal resistance. The 38.2% Fibonacci retracement from the late December highs to the April 5th lows is just above near 0.8762. Support below is at the top downward sloping trendline of the descending wedge near 0.8575, ahead of the recent lows at 0.8478.
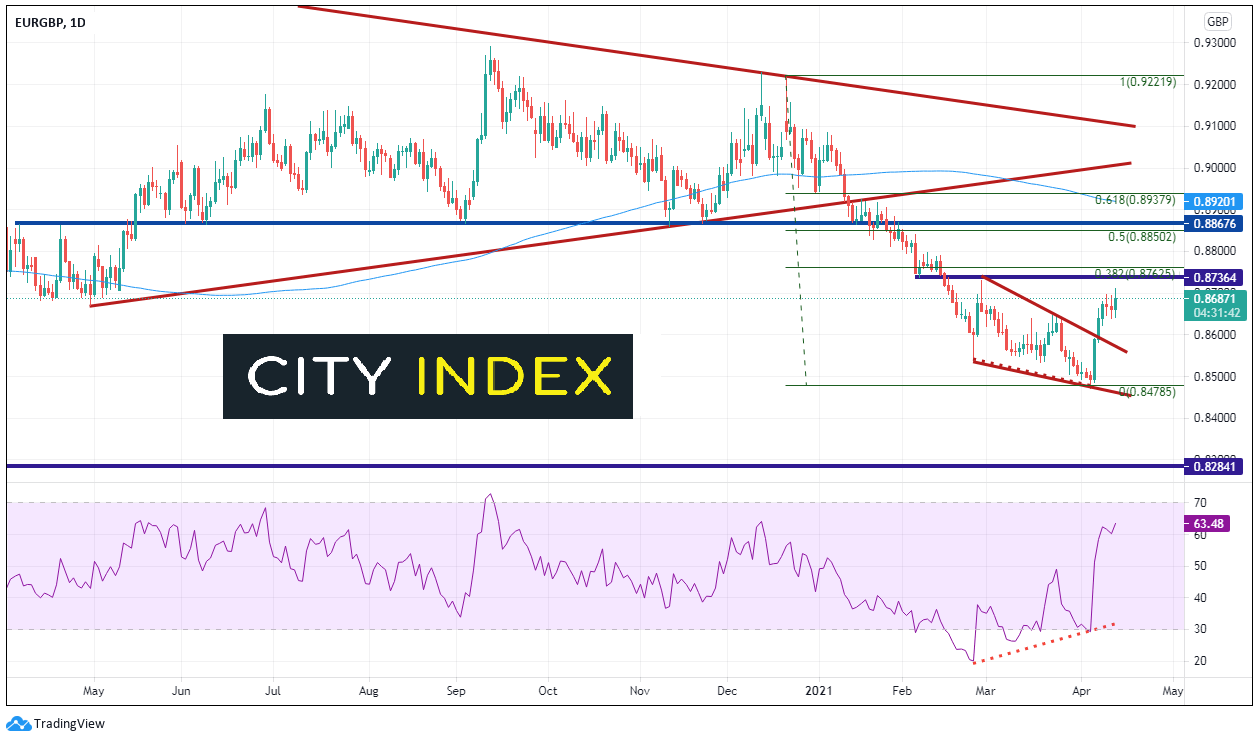
Source: Tradingview City Index
Forex market hours: When is the best time to trade Forex?
Most central banks say they are more concerned about employment than inflation. However, most also say they will be accommodative for a while. But can the markets force their hand? The second quarter is going to be all about economic expansion as the world “re-opens”. Which countries can control the spread of the coronavirus and rollout the vaccines the quickest? The countries that can do that best are the countries that will grow the quickest, and therefore, are the countries that will win the currency battle in Q2.
Learn more about forex trading opportunities
Latest market news
Today 05:45 AM
Yesterday 11:09 PM
Yesterday 11:01 PM
Yesterday 04:00 PM
Latest Forex articles
Yesterday 11:09 PM
Yesterday 04:00 PM
Yesterday 04:19 AM
April 22, 2024 04:33 PM