FTSE stretching towards higher highs
The FTSE 100 (daily chart) has continued to display unrelenting strength in its apparent quest to establish even higher highs. Having just reached a new […]
The FTSE 100 (daily chart) has continued to display unrelenting strength in its apparent quest to establish even higher highs. Having just reached a new […]
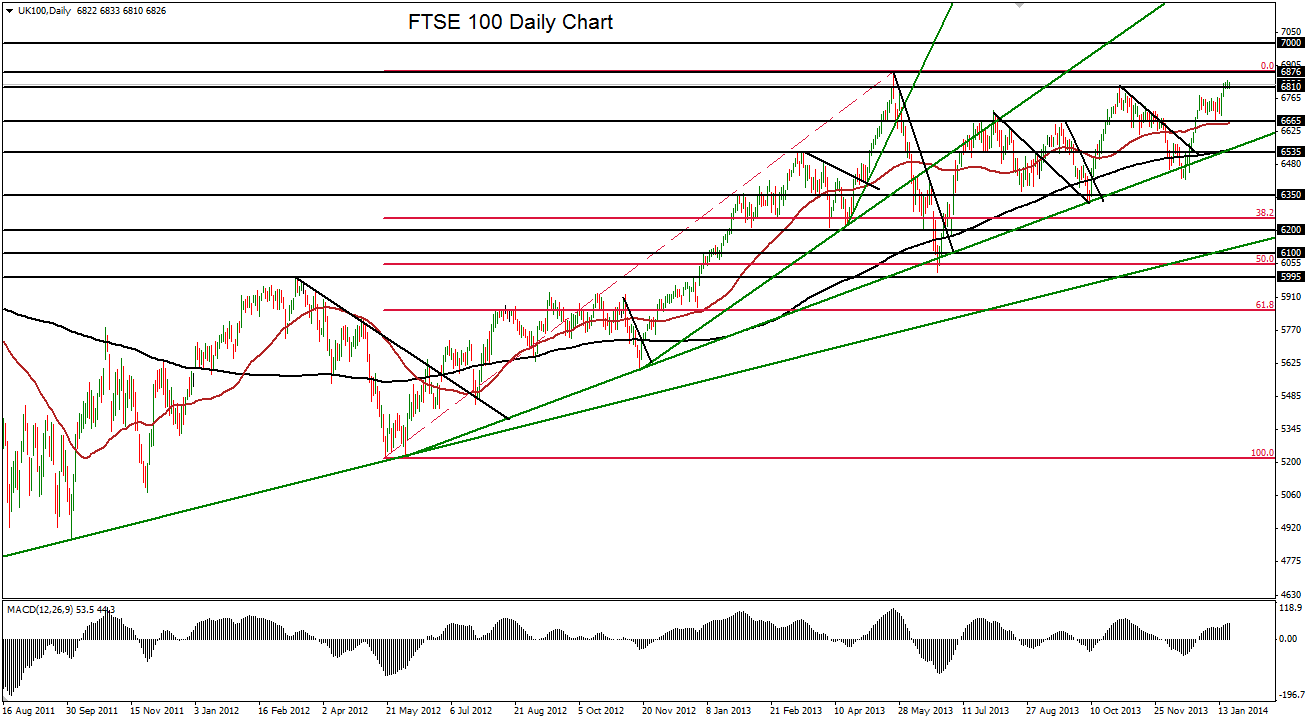
The FTSE 100 (daily chart) has continued to display unrelenting strength in its apparent quest to establish even higher highs. Having just reached a new eight-month high of 6843 on Friday, surpassing October’s 6819 high, the index currently faces clear resistance around the 6876 level, the multi-year high that was established in May 2013.
From the noted 6819 peak at the end of October, the FTSE corrected down by almost six percent to its December low of 6417, before rebounding. This rebound occurred in a highly significant technical price area, as it closely conformed to a major bullish trend line extending back to the mid-2012 lows around 5225. Since that rebound occurred, price action has provided a strong indication of the continuing strength of the entrenched uptrend after the most recent corrective pullback. The 50-day moving average is also rising steadily above the 200-day average, which has generally been the case since August 2012.
Currently the index has just broken out above a tight flag-like consolidation to hit its current high above the noted October 6819 high. The FTSE will need to break above the aforementioned resistance at the multi-year high of 6876 in order to assert a true continuation of the entrenched bullish trend. Such a breakout could put the index on track first to target a retest of its 6950 all-time high (established at the end of 1999), and then potentially the 7000 psychological resistance level. Near-term downside support on another potential pullback currently resides around the 6650 level.