FTSE Stocks head south as volatility set to rise
Yesterday’s U-turn on Wall Street caused global stock index futures to turn red, leading to a lower open in Asia and Europe. Though the indices […]
Yesterday’s U-turn on Wall Street caused global stock index futures to turn red, leading to a lower open in Asia and Europe. Though the indices […]
Yesterday’s U-turn on Wall Street caused global stock index futures to turn red, leading to a lower open in Asia and Europe. Though the indices did manage to bounce back modestly off their lows, it appears as though the bullish momentum is fading once more at the time of this writing at midday here in London. US index futures now point to a flattish open on Wall Street. Sentiment in the stock markets thus remains cagy. Speculators are still wondering what really caused this sharp rally earlier this week and are therefore exercising some caution. Was it the slightly better-than-expected Chinese exports figure that led to calls that the markets had over-reacted to the Chinese slowdown story? Or was it perhaps hopes about further PBOC intervention? Whatever the reason, the markets displayed a big sigh of relief, leading to a sharp rally in the first half of the week. But that rally has now lost momentum.
The renewed selling pressure now should not come as a major surprise. After all, China’s trade figures released on Tuesday were still very weak. In addition, there is great uncertainty about economic growth elsewhere across the globe and about the timing of US interest rate rises. It is therefore very much likely that we will see some more volatility until at least the middle of next week. Tomorrow’s key data will be the latest US consumer sentiment survey from the University of Michigan. Then, at the weekend, there will be some more Chinese data to provide some direction for early next week, namely industrial production. The Bank of Japan’s monetary policy decision is on Tuesday when we will also have the UK CPI, Germany’s ZEW Economic Sentiment survey and US retail sales. UK jobs data and US CPI will be published on Wednesday, ahead of more central bank rate decisions on Thursday from the Swiss National Bank and of course the all-important US Federal Reserve.
The Bank of England has meanwhile left interest rates unchanged for the 78th months in a row. Minutes from the Monetary Policy Committee’s last meeting have revealed few surprises, although the pound did manage to find some initial support as the markets interpreted the minutes as slightly less dovish and more hawkish than expected. In particular, it was probably the BoE’s admission that that the recent global developments had not altered the MPC’s views materially: “While these developments have the potential to add to the global headwinds to UK growth and inflation, they must be weighed against the prospects for a continued healthy domestic expansion.” With the UK central bank still on course to raise rates at some point next year, this may help to underpin the pound in the short term which in turn may undermine UK exports.
FTSE forms further bearish technical signals
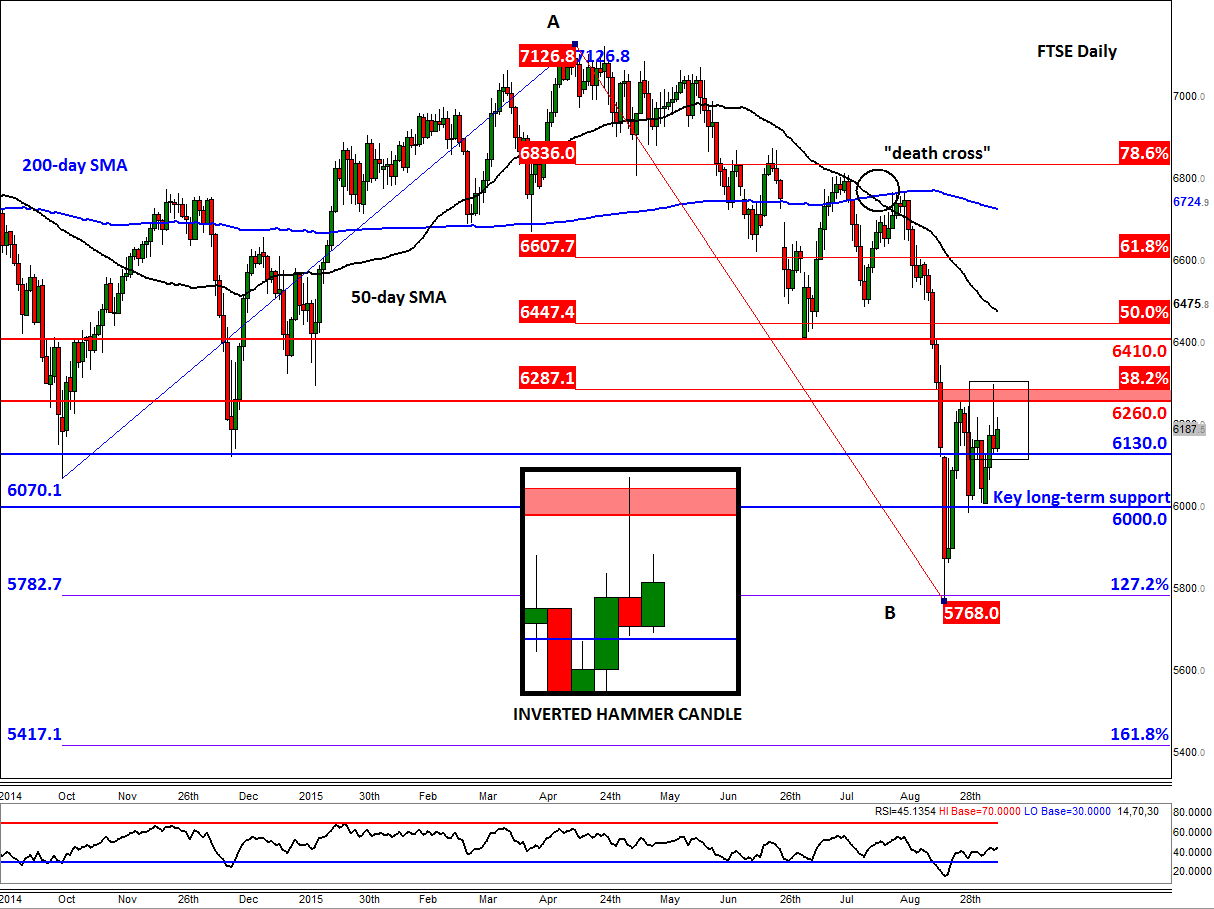
Following yesterday afternoon’s sell-off, the FTSE future ended near the day’s lows and as a result our UK 100 cash index has formed an inverted hammer candle on its daily chart. This particular candle stick pattern suggests that further weakness is now likely after yesterday’s shift from buying to selling pressure around the technically important area of 6260 to 6290. As can be seen from the chart, the upper end of this range corresponds with the shallow 38.2% Fibonacci retracement level of the downswing from the record high that was achieved in April. More importantly, the lower end of this range was the high from a couple of weeks ago when the index had formed a bullish-looking hammer candle on its weekly chart. It is likely that momentum traders were hoping to see some follow-up technical buying above this level and had thus placed stop buy orders some distance above that weekly candle. This is also where some of the existing sellers’ stop loss orders were likely to have been placed. Now, the reason why I have mentioned this is that the breakout that traders were looking for has failed to materialise. This is important because those traders are likely to have adjusted their views from bullish to bearish and may now try to sell rather than buy.
If this thesis proves to be correct and we see a break below today’s lows and support at 6130, then one should expect to see the onset of a fresh wave of technical selling towards the next key and long-term support at 6000, and potentially beyond. Conversely, if we now don’t see a continuation in the selling pressure then a sharp break to the upside could be the outcome. Even so, it is unlikely that the potential rally would last too long given that the long-term technical outlook appears to have changed to bearish now (e.g. the breakdown of a long-term bullish trend line on the weekly chart).