FTSE rising towards the New Year
December 23, 2013 – The FTSE 100 (daily chart) has shown little to no signs of relenting in its long bullish run that has closely […]
December 23, 2013 – The FTSE 100 (daily chart) has shown little to no signs of relenting in its long bullish run that has closely […]
December 23, 2013 – The FTSE 100 (daily chart) has shown little to no signs of relenting in its long bullish run that has closely mirrored other major global indices.
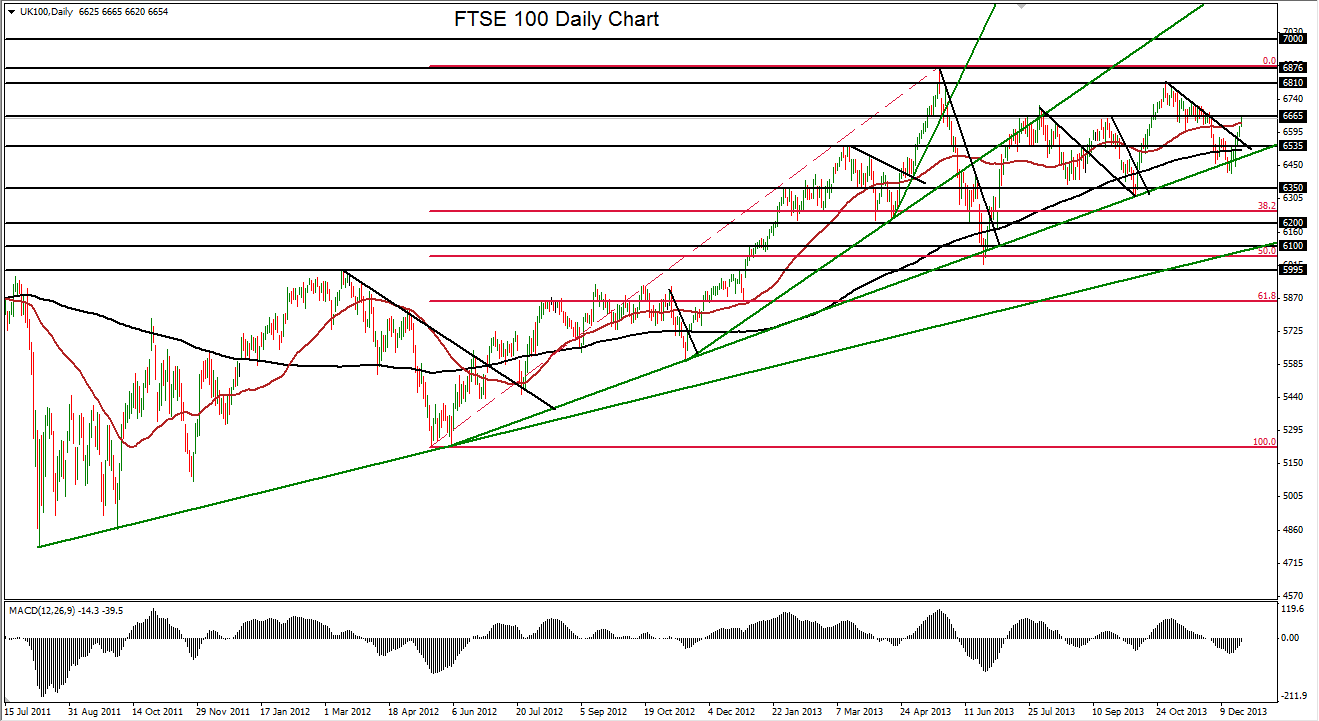
From its most recent significant upswing to the 6819 peak at the end of October, the FTSE corrected down by almost six percent to its December low of 6417 – before rebounding.
This rebound occurred in a highly significant technical price area, as it closely conformed to a major bullish trend line extending back to the mid-2012 lows around 5225. The index dipped slightly below this trend line, as it did after a similar correction in June, but the rebound that began in mid-December has been swift and sure; breaking out above a short-term counter-trend resistance line drawn from the noted 6819 high.
This rebound provides a strong technical indication of the continuing strength of the entrenched uptrend after the most recent corrective pullback. The 50-day moving average is also rising steadily above the 200-day average, which has generally been the case since August 2012.
Currently, the index has reached a key resistance zone around the 6650-6665 price region. Closing in on the end of the year and into the beginning of the New Year – if there is further upside momentum and trend continuation above this resistance zone – the FTSE should likely begin to target a re-test of the noted October 6819 high and then the May 6876 long-term high.
