FTSE rebounds and rallies in attempt to regain highs
The FTSE 100 (daily chart shown below) rebounded sharply on Tuesday after hitting a low of 6670 early in the week. That low dipped slightly […]
The FTSE 100 (daily chart shown below) rebounded sharply on Tuesday after hitting a low of 6670 early in the week. That low dipped slightly […]
The FTSE 100 (daily chart shown below) rebounded sharply on Tuesday after hitting a low of 6670 early in the week.
That low dipped slightly below the 50-day moving average before bouncing back from just above key support and currently advancing to approach long-term resistance once again.
This long-term resistance was first established in May as more than a decade-long high at 6876. It was then closely approached and re-tested in January with a high at 6867.
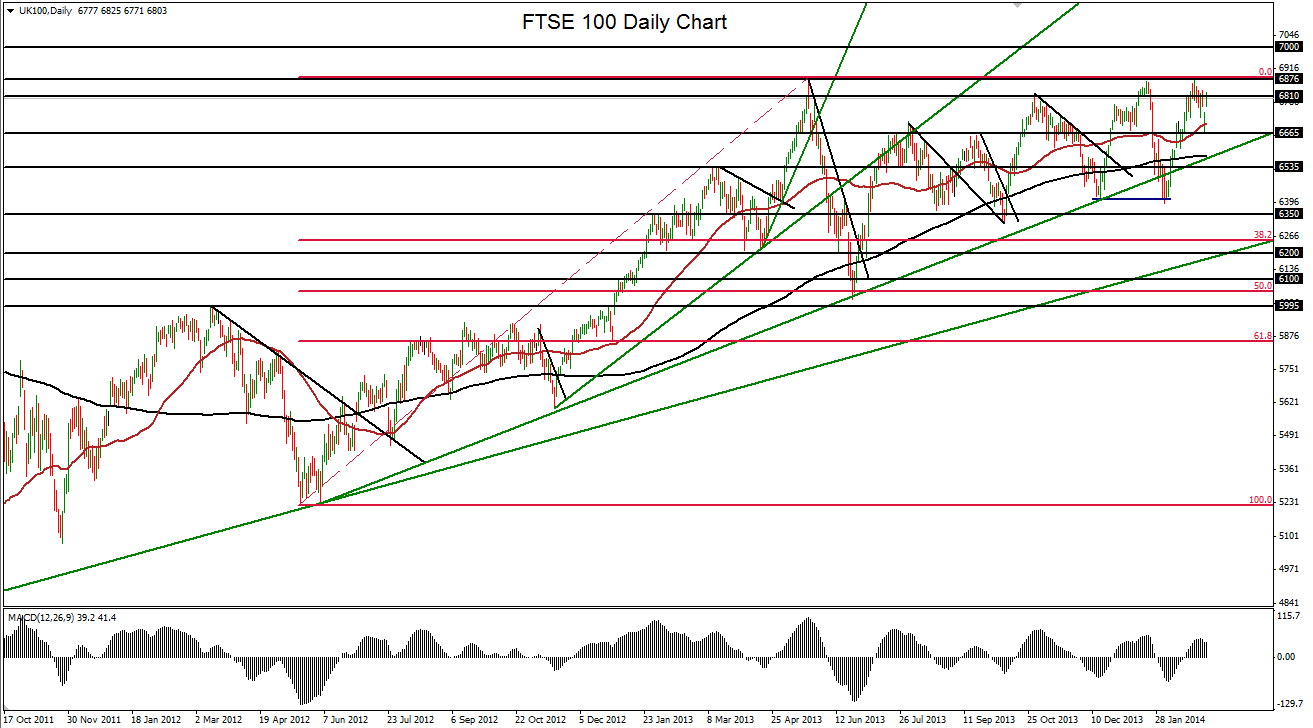
Most recently, it was slightly surpassed with a new long-term high at 6882 just last week.
These three highs collectively form a major resistance barrier for the index.
After the noted rebound this week, the FTSE has been rallying for yet another attempt at resistance.
In the event that this goal is reached, the index would be situated at a critical price juncture that could potentially put it on track once again to continue the multi-year bullish trend.
A breakout above resistance could then target the 7000 psychological level to the upside.
Near-term downside support on another pullback within this strong bullish trend continues to reside around the 6650-6670 price area.
