FTSE reaching for long term highs
The FTSE 100 (daily chart) has risen by around 6.5% within the past two weeks thus far on a sharp rebound from its 6393 low […]
The FTSE 100 (daily chart) has risen by around 6.5% within the past two weeks thus far on a sharp rebound from its 6393 low […]
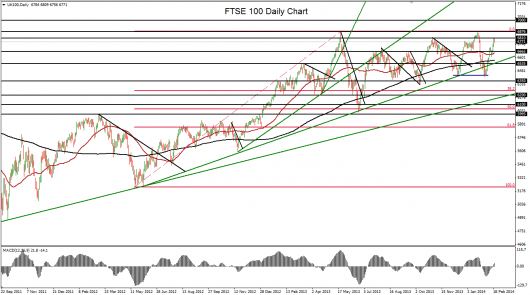
The FTSE 100 (daily chart) has risen by around 6.5% within the past two weeks thus far on a sharp rebound from its 6393 low in early February. The dip to that low from January’s 6867 high was quick and steep, but fell short of becoming a full correction, which is normally defined as a decline of 10% or more. Having regained much of the ground lost during that pullback, the index has just reached a high that closely approaches the resistance imposed by the intermediate high of 6819 that was hit in late October 2013.
The recent bullishness also places the FTSE on track to target another re-test of the 6875 area that was established as more than a decade-long high in May 2013 and was closely re-tested for the first time at the noted January 6867 high. Yet another re-test of that high would place the index at a critical price juncture that could potentially put it on track once again to continue the multi-year bullish trend. A breakout above that resistance could then target the 7000 psychological level to the upside. Near-term downside support on another pullback within this bullish trend tentatively resides around the 6650 price area.
