FTSE plunges to 200 day moving average and trend line
January 27, 2014 – The FTSE 100 dropped substantially last week (see daily chart below) after hitting a high of 6867 by mid-week, which fell just […]
January 27, 2014 – The FTSE 100 dropped substantially last week (see daily chart below) after hitting a high of 6867 by mid-week, which fell just […]
January 27, 2014 – The FTSE 100 dropped substantially last week (see daily chart below) after hitting a high of 6867 by mid-week, which fell just slightly short of May’s 6876 multi-year high.
These two highs were so close that they could be considered a double-topping formation, and the price area of 6867-6876 may be considered exceptionally strong resistance.
After hitting the second top last week, the index has since fallen precipitously to break down below the 6650 level and the 50-day moving average.
It then went on to fall further today to hit both the key 200-day moving average as well as a major uptrend line extending back to the mid-2012 lows around 5225.
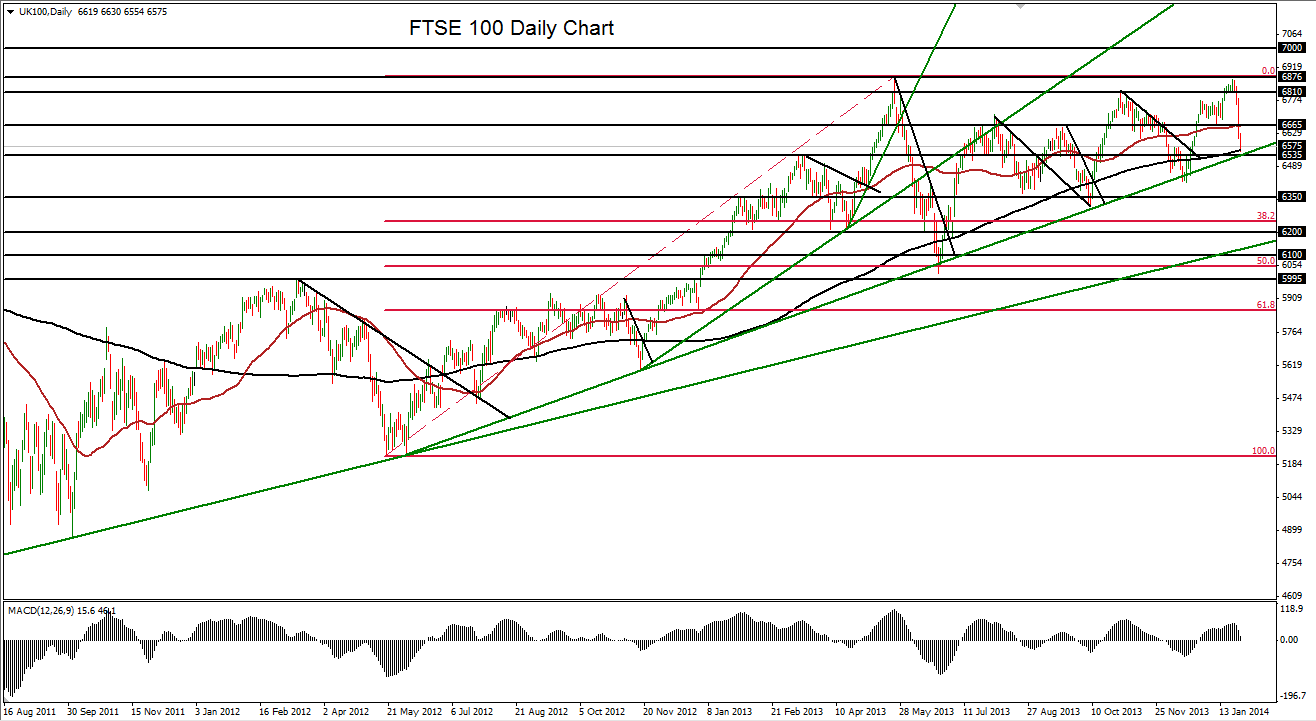
At the current time, the pullback constitutes around a 4.5% decline: not yet enough to qualify as a full correction. In addition, the FTSE is still within the confines of a strong, long-term bullish trend.
If a recovery of the current pullback occurs, this trend will have remained strong and unbroken. In this event, the major upside target resides around the noted 6867-6876 double-top resistance once again, followed by the 6950 all-time high (established at the end of 1999).
If, however, there is a strong breakdown below the 200-day moving average and the uptrend line, there could be a strong case for a full downside correction, with key intermediate support levels around 6350 and 6200.
