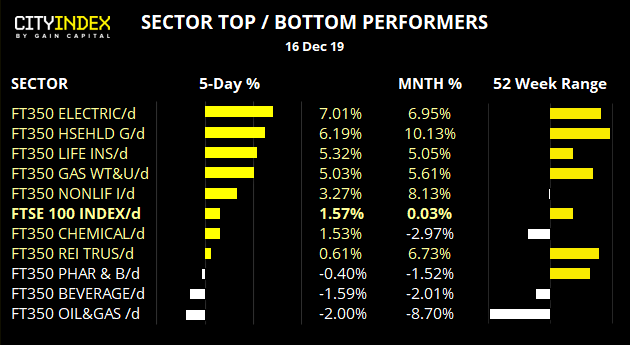


- FTSE 100 teased traders with a break above 7,400 but it was not to be, seeing the index close at 7373.20 by Friday’s close. This means it remains within the 7000 – 7450 range it has calved out since August. Ultimately, we’d need Santa’s rally to kick into gear this week if there’s hope of a breakout at all.
- Construction and building materials sector remains the strongest YTD, and currently trades at its highest level since May 2018. Electronic and Electrical Equipment, General Retailers and General Financials are close behind and trade just off their highs.
- The Oil & Gas Index is on track for the weakest sector this year, currently down -9.4% YTD.
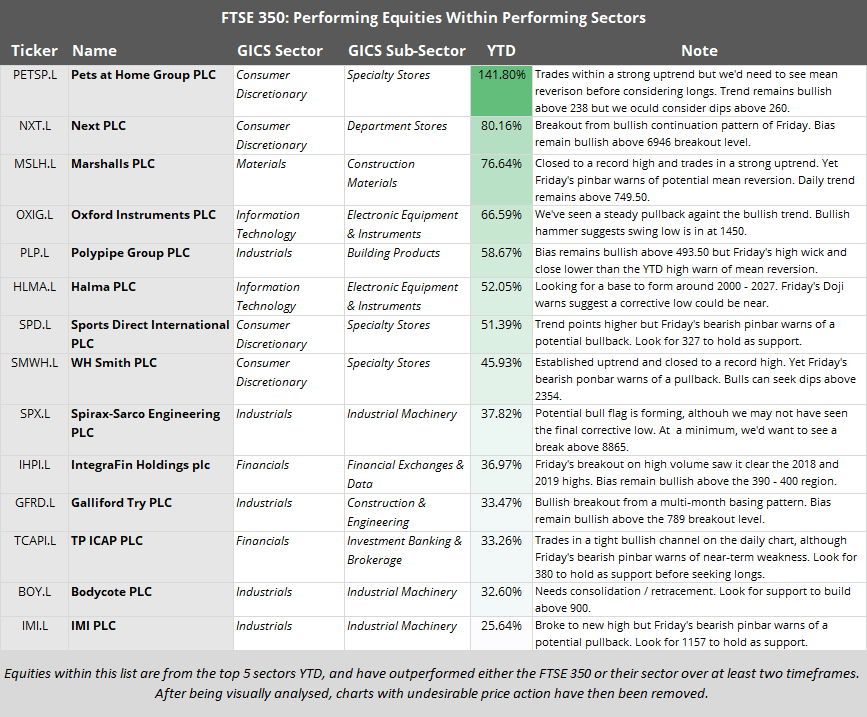
The following stocks, if not from the list above, have been selected due to displaying price action characteristics of interest.
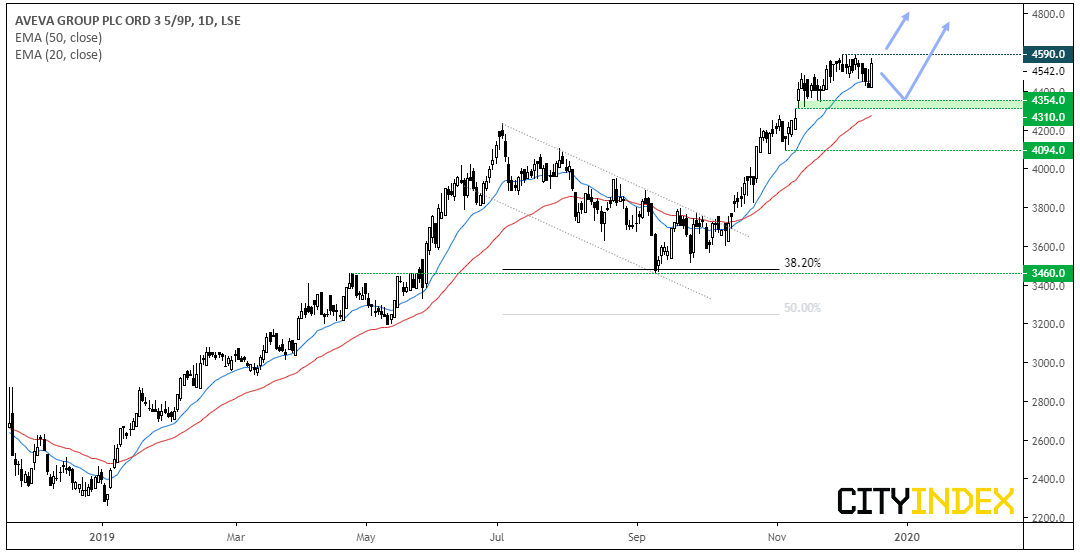
Aveva Group plc CFD/DFT: This stock continues to show up on our watchlist as it continues to push to new highs. Friday’s bullish engulfing candle suggests a swing low could be in after forming a small flag pattern. However, unlike some equities on Friday, its bullish close was not so extreme that it looks immediately over extended and therefore due some mean reversion. Traders can either seek a break above 4600 or wait to see if a base builds above the 4310 – 4354 region.
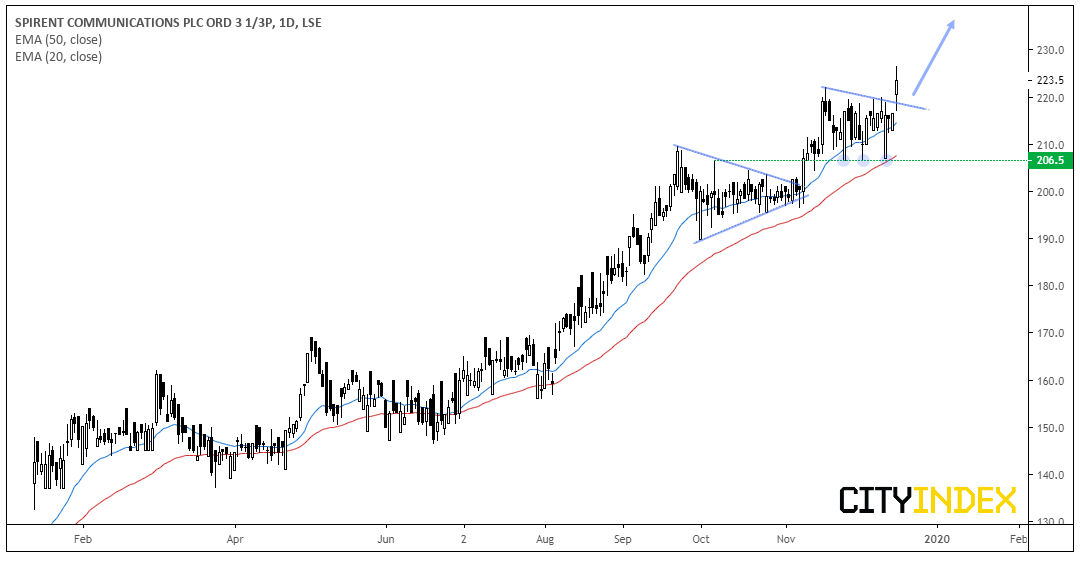
Spirent Communications PLC CFD/DFT: Closing the week at its highest level since 2001 on Friday, we see further upside potential. With three failed attempts to break below 206.50, there’s clearly demand around that level so we remain bullish whilst prices trade above it. We can see that patience would be required here as price action tends to alternative between bullish and bearish frequently, yet the trend is clearly pointing higher.
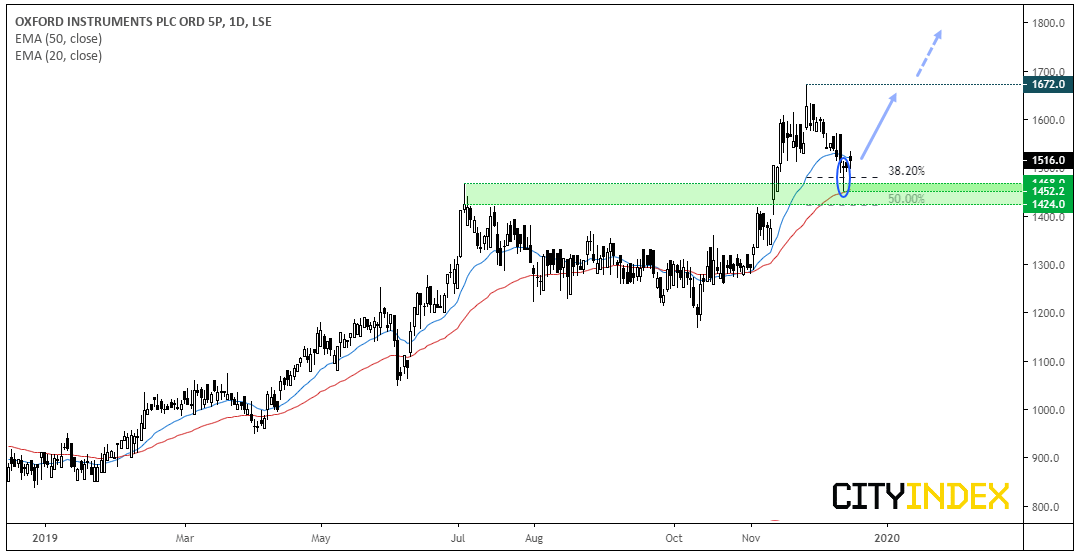
Oxford Instruments CFD/DFT: Since hitting a 5.5 year high, we’ve seen a retracement test (yet close above) the 38.2% Fibonacci level with a bullish pinbar. Moreover, the 50-day eMA is acting as support and it’s in the vicinity of the June highs. We therefor suspect the corrective low is in. Bulls could wait for a break of a corrective line or Friday’s high to assume bullish resumption and for a retest of the 1672 high. A close below 1424 places it onto the backburner.
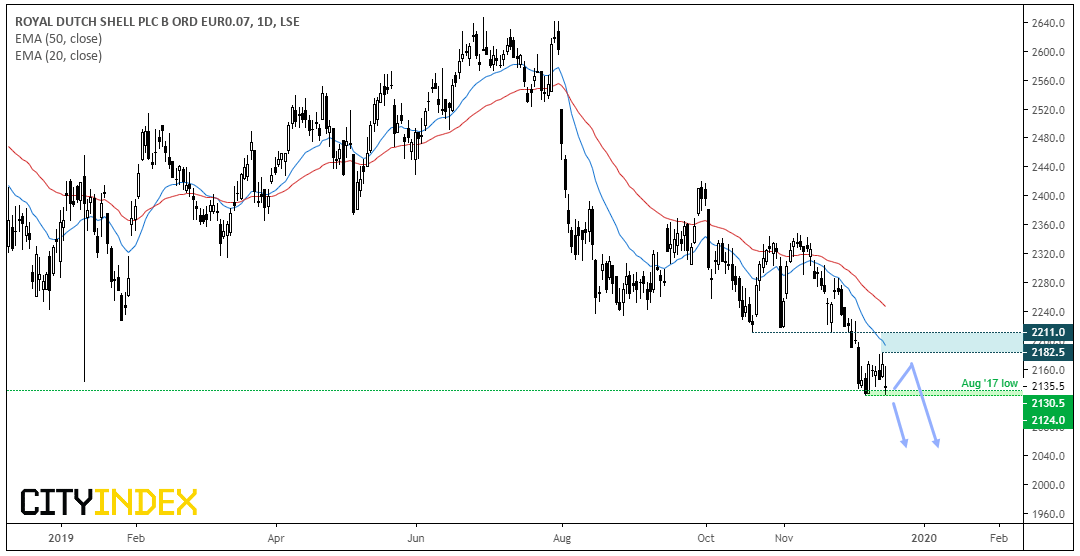
Royal Dutch Shell A CFD/DFT: Prices are on the cup of breaking to new lows. However, as we saw a heavy volume day respect support, it leaves room for a bounce prior to its next breakdown. Bias remains bearish below the 2182.50 high. Whilst a break above this key level doesn’t mean it won’t break to new lows later, it does place it onto the backburner. Whereas a direct break below 2124 assumes bearish continuation.
Latest market news
Today 11:14 AM
Today 08:28 AM
Yesterday 03:30 PM
Latest UK 100 articles
August 22, 2023 08:31 AM
August 4, 2023 07:13 AM
July 20, 2023 07:07 AM
July 5, 2023 07:15 AM