FTSE in the final stretch
The FTSE 100 (daily chart) has approached the final stretch of 2013 in an exceptionally strong position, much like other major global indices. While not […]
The FTSE 100 (daily chart) has approached the final stretch of 2013 in an exceptionally strong position, much like other major global indices. While not […]
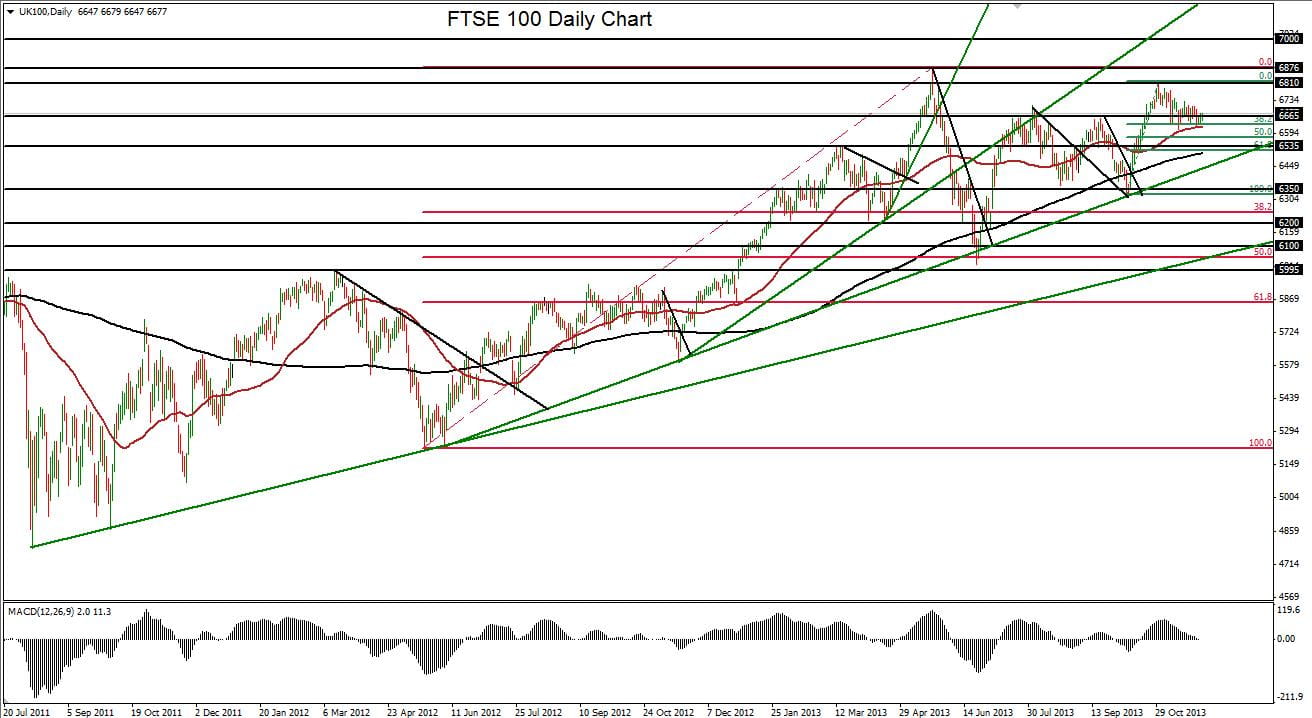
The FTSE 100 (daily chart) has approached the final stretch of 2013 in an exceptionally strong position, much like other major global indices. While not at record highs like its US counterparts, the FTSE is securely entrenched within a rather steep bullish trend that extends back at least to the May 2012 5225-area low, which was the beginning of the current accelerated uptrend line.
Currently the index has been experiencing a relatively shallow pullback for the past month after hitting an intermediate high of 6819 in late October. This pullback has only brought the FTSE down to around a 38.2% Fibonacci retracement of the prior bullish run, before stabilising. Despite this rather mild pullback thus far, the index is still well above its 200-day moving average as well as firmly on top of its 50-day moving average.
While the strong bullish trend is far from being threatened, there is significant room for further downside correction before a potential resumption of the uptrend. Major downside support for this potential correction resides around the key 6535 level as well as the noted accelerated uptrend line. The clear upside price objective on a rebound and trend continuation would be a re-test of the 6875-area long-term high.