FTSE finally breaks out of consolidation on China oil
European equity markets are sharply higher today and Wall Street futures point to a firmer open on Wall Street. The catalyst behind the bounce has […]
European equity markets are sharply higher today and Wall Street futures point to a firmer open on Wall Street. The catalyst behind the bounce has […]
European equity markets are sharply higher today and Wall Street futures point to a firmer open on Wall Street. The catalyst behind the bounce has undoubtedly been the recent sharp rise in oil prices to new 2016 highs. This has boosted commodity stocks in particular. Oil prices eased off their best levels overnight after data from the American Petroleum Institute (API) showed a sharp build in oil inventories in the US. If confirmed by official data from the Energy Information Administration (EIA) this afternoon then we may see some further profit-taking ahead of the key meeting in Doha on Sunday between Russia and large OPEC members. In addition to oil, sentiment has been boosted by receding fears about China’s economic health. Recent data from the world’s second largest economy have been decent. And that trend continued overnight as fresh trade figures revealed a significant rise in exports, up a good 18.7 per cent during March, while imports stabilised with a small drop. China will remain in focus and on Friday we will find out how the economy performed in terms of growth in the first quarter, while the monthly industrial production and retail sales figures should provide a more up-to-date snapshot of demand.
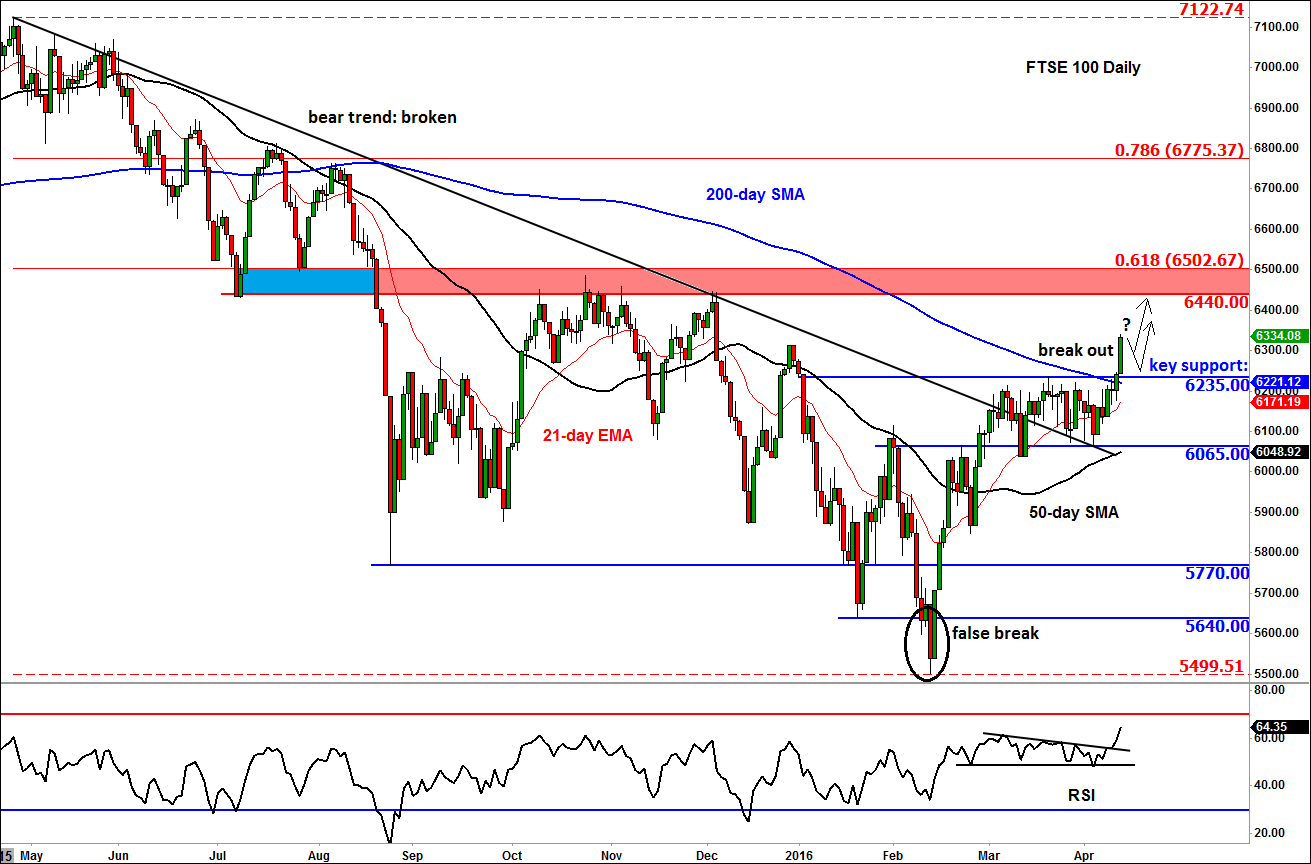
From, a technical point of view, the FTSE 100 has finally broken out of its lengthy consolidation range between 6065 support and 6235 resistance. It had spent about six weeks in this relatively tight range. The large amount of time in consolidation here suggests this breakout could lead to a significant continuation in the upward trend. Clearly, the sellers have been proven wrong. Unless the index forms a clear reversal pattern now, some of these previously bearish speculators may join forces with the existing bullish traders to buy the dips, which may strengthen the momentum.
Going forward, the key support to watch will be the previous resistance around 6235 – the bias would remain bullish while the FTSE holds above here on a closing basis. However a decisive break back below this level would invalidate the bullish breakout, in which case a sharp sell-off could be the outcome. In terms of the next potential resistance to watch for the FTSE, the shaded area on the chart, around 6440-6500, is an interesting region to watch. The 61.8% Fibonacci retracement against the previous all-time high meets previous support-turned-resistance there. If it gets there, then we may see some profit-taking activity around this area. Meanwhile the RSI momentum indicator has not reached the “overbought” levels of >70, so the rally may still have some juice left in it before the profit-takers show up.