FTSE falls in expected correction
The FTSE 100 (daily chart) has dropped sharply for the third consecutive day this week, establishing a new seven-week low. This decline thus far constitutes […]
The FTSE 100 (daily chart) has dropped sharply for the third consecutive day this week, establishing a new seven-week low. This decline thus far constitutes […]
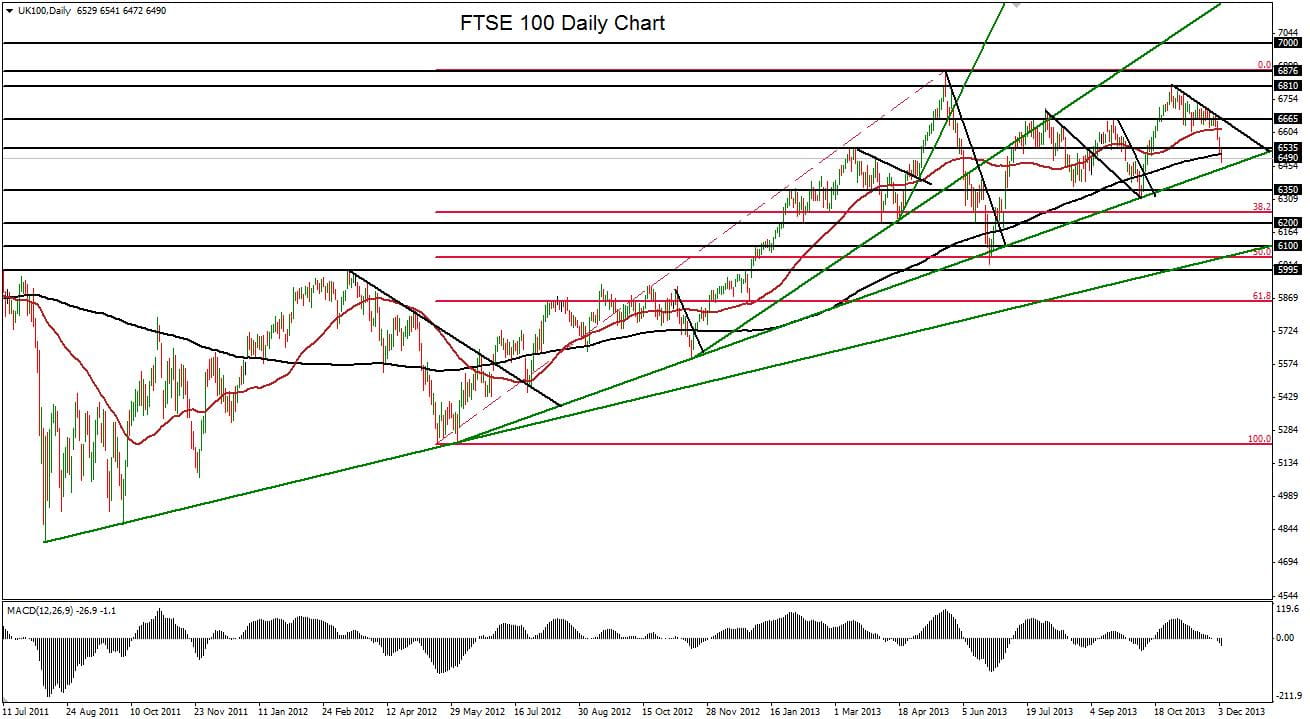
The FTSE 100 (daily chart) has dropped sharply for the third consecutive day this week, establishing a new seven-week low. This decline thus far constitutes an expected magnitude of correction after the index over-extended to hit an intermediate high at 6819 in late October. The current drop has brought the FTSE tentatively below both its 50-day and 200-day upward-sloping moving averages, which have also notably occurred during both of the last two major pullbacks – in late June and early October.
What is also now occurring that has occurred in the last two major pullbacks is a conspicuous approach of the accelerated uptrend line that extends back to the May 5225-area lows. Whether the index turns back to the upside at or around this trend line support area as it did the last two times still remains to be seen. If this turn back up from support does indeed occur, upside resistance targets reside around 6650 and then once again up in the 6800 area. In the event of a breakdown below the current trend line, key support resides around the 6315 level.