FTSE dragged by M amp A concerns and gold slide
Thursday’s FTSE 100 sell-off reveals that sentiment may not have stabilised after all in the wake of Wednesday’s Trump shock.
Thursday’s FTSE 100 sell-off reveals that sentiment may not have stabilised after all in the wake of Wednesday’s Trump shock.
After an eerie calm a day ago, jitters were seen on both sides of the Atlantic as major U.S. stock indices faced renewed volatility.
The VIX Volatility Index, AKA the ‘fear gauge’, also lived up to its name.
It swung 11% into the black at one point having extended Wednesday’s decline by 8% just hours before.
A broad and rekindled trepidation about the economic impact of a Trump administration also linked back to the FTSE’s own particular burden on Thursday.
There was a sharp slide of British American Tobacco and Imperial Brands (formerly Imperial Tobacco) shares.
Just as investors stateside grew wary of AT&T’s deal to buy Time Warner, given President elect Trump’s stated dislike of big corporate tie-ups, BAT’s proposed $47bn buy-out of Reynolds American was also met with a more sceptical eye. BAT shares fell 6%.
Highly-rated precious metals miners, Fresnillo and Randgold Resources also fell, by around 11% apiece, after a rebound of gold from monthly lows fizzled out.
Gold prices have in fact fallen by 6% from early Tuesday highs.
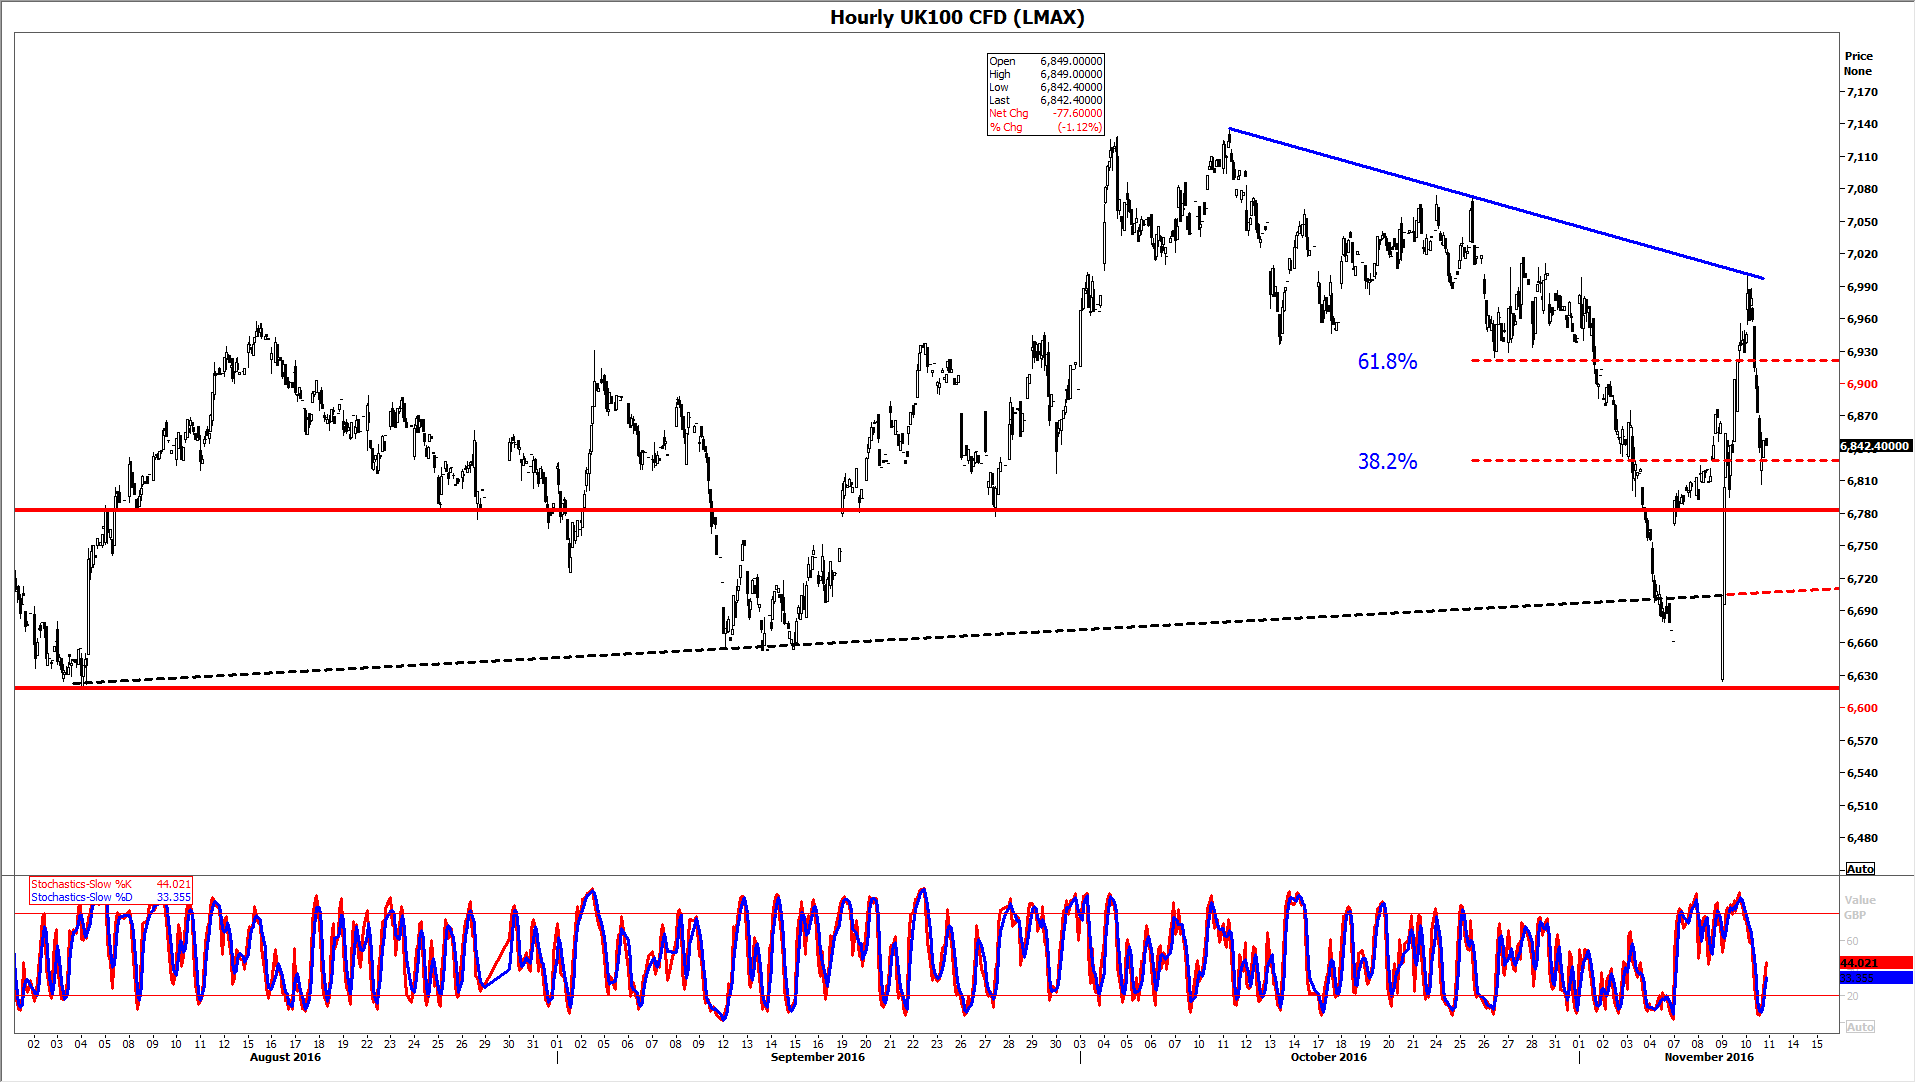
However, Wednesday’s whipsaw violated a legitimate rising line from August and stopped just short of the lower bound of the summer’s 6618/6782 support/resistance zone, as shown by the hourly chart of LMAX Exchange’s FTSE derivative below.
At the time of writing, it looked like the market was confirming it had filled what is essentially a gap from Wednesday’s volatile comeback.
(The disorderly snap-back on that day came in thin volume over just two hours).
As long as the FTSE’s longer-term rising trend is intact (not shown) aside from the breach in June—investors should only get really worried if lower support at 6618, established in July, gives way.
But in the event of another failed test of the upper bound of support at 6782, traders would need to face the growing risk that the rising line from early August, and lower support at 6618, might no longer hold.
In turn, the viability of the year’s longer-term uptrend, in place since February, would also be called into question.
Focus would then move on to 6586/6513, a consolidation zone in early-July.
In any case, an upper declining trend over the last month (blue) together with the lower ascending line from August (black dotted line) creates a symmetrical triangle.
Completion of the pattern tends to be followed by a breakout, though in principle the jump can be in either direction.
Please click image to enlarge
