FTSE down on commodity market rout Arm
The FTSE is trading lower for a second consecutive day, tracking losses across the wider European markets. Sentiment has turned a little sour after earnings […]
The FTSE is trading lower for a second consecutive day, tracking losses across the wider European markets. Sentiment has turned a little sour after earnings […]
The FTSE is trading lower for a second consecutive day, tracking losses across the wider European markets. Sentiment has turned a little sour after earnings from a few US household names disappointed expectations over the past couple of days, though overall Wall Street results have generally been decent so far. On top of this, the rout in the commodity markets continue to weigh on share prices of mining and energy companies which denominate the FTSE 100. Gold prices have fallen for various reasons of late, including a stronger US dollar, the lack of safe haven demand during the height of the Greek crisis 2.0 and evidence of weaker physical demand from China. Oil meanwhile is held back mainly because of the excessive supply of the stuff across the globe. UK stock market investors may also be worried that the end of an era of historically low interest rates is just around the corner now, with the Bank of England recently dropping its previously dovish stance and talking up the prospects of raising rates soon. On a micro level, the somewhat disappointing earnings outlook from Apple has weighed on the share price of Arm, a company which supplies the chips for Apple’s devices. Of course, Arm’s own results were not that bad today. Preventing an even larger decline in the FTSE is the rallying share price of easyJet. The British low-cost airline said its annual profit would increase by up to 14% and as revenue performance in the three months to the end of June was better than the company had predicted in May, boosted by stronger demand for beach holidays.
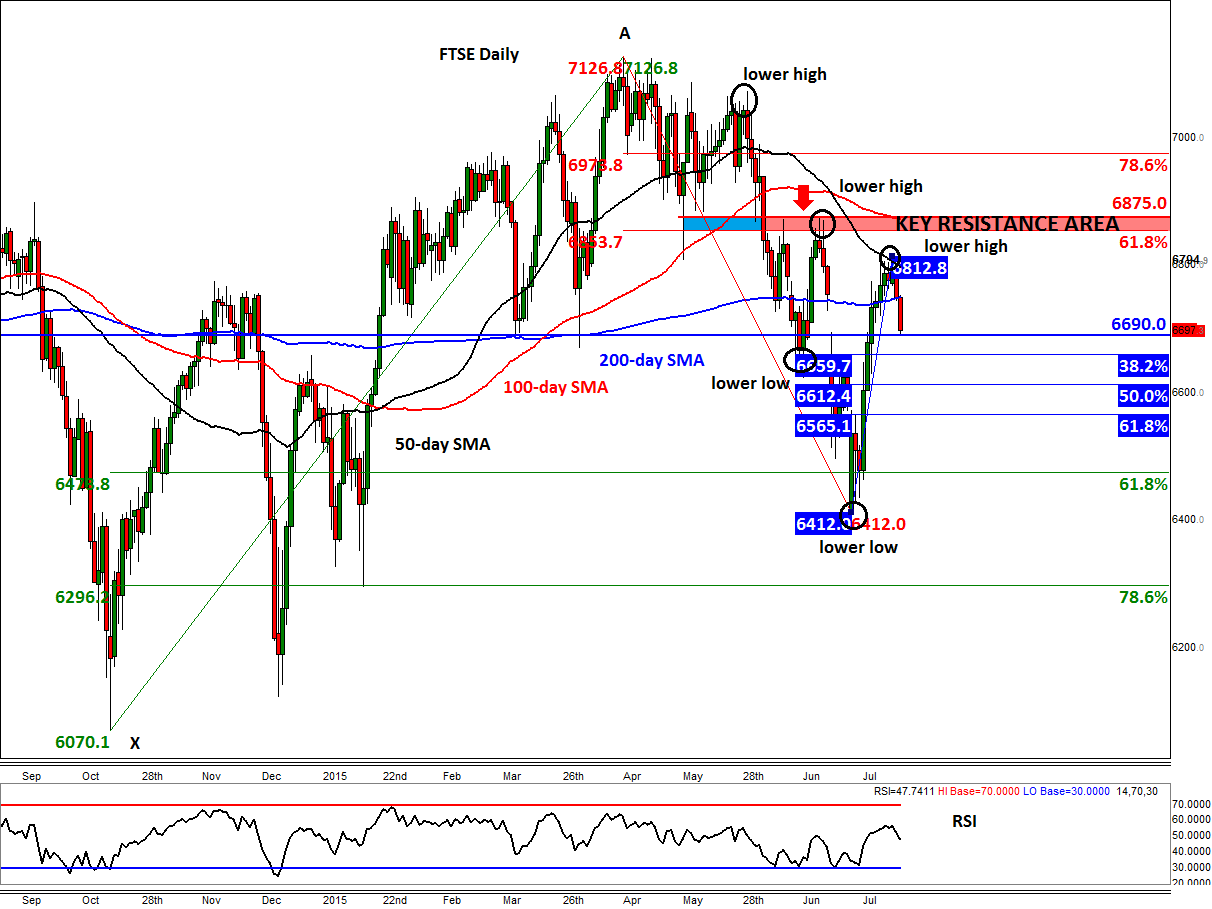
Meanwhile from a technical point of view, the FTSE is still making lower higher and lower lows, which is a common characteristic of a bear market. The last lower high was established in June around 6875. Thus, for as long as the index trades below this level, one has to be wary of another potential correction. In fact, it is the area below 6875 and above 6850 which is a major resistance zone that needs to be watched closely. As well as the June high, the 100-day moving average converges with the 61.8% Fibonacci retracement level of the most recent downswing there. Preventing the index to test that area has been the 50-day moving average, at 6795, which has offered some strong resistance in recent days. As a result of the selling over the past couple of days, the FTSE is again below its 200-day moving average now. It is currently testing the pivotal 6690 handle which had been both support and resistance in the past.
Though the chart of the FTSE does look a little bit toppy, one cannot ignore the manner in which the index has rallied since forming a low at 6412. Following such a sharp move higher, it is only natural that the index is now pausing for breath. For this view to be valid though we do need to see the FTSE hold its own above the support levels such as 6690 or the Fibonacci levels shown on the chart now. IF and when the FTSE violates the downward trend by creating a decisive higher high above 6875 then we could see a sharp move to the upside. In that scenario, we wouldn’t be surprised if it were to make a run at or indeed break its all-time high.