FTSE down for fourth day testing key support
European stocks are once again heading lower as investor concerns grow about the prospects of Greece actually leaving the Eurozone. Though such an outcome in […]
European stocks are once again heading lower as investor concerns grow about the prospects of Greece actually leaving the Eurozone. Though such an outcome in […]
European stocks are once again heading lower as investor concerns grow about the prospects of Greece actually leaving the Eurozone. Though such an outcome in our view is still unlikely, the probability of it becoming a reality is increasing as each day goes by without a deal being agreed upon. Evidently, investors are adjusting their risk exposures accordingly by reducing their equity holdings. Also unnerving the stock market bulls is the economic slowdown in China, with some being disappointed that the PBoC has not been more aggressive in loosening its policy. However, judging by the reaction of the Chinese stock markets recently, traders are now fully expecting the central bank to make a bold move. After all, the consumer price index in China grew last month at its slowest pace since January. The 1.2% year-over-year reading has not only missed the expectations, it is also well below the government’s 3% target. Thus a potential PBoC rate cut could offer at least some short term relief for the global stock market sell-off.
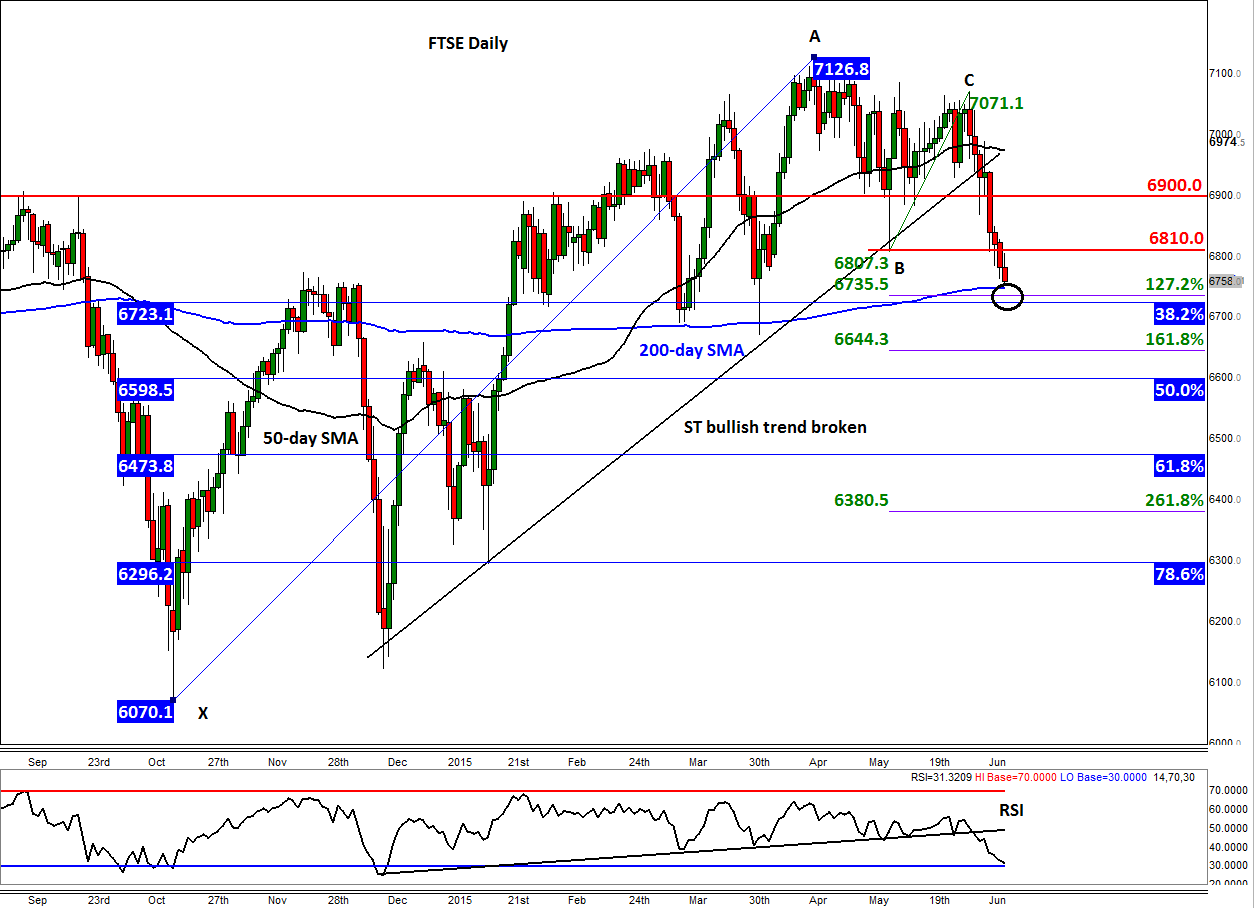
The FTSE is moving lower more reluctantly compared to its mainland European peers, but it is being dragged into the mix nonetheless. It has broken several support levels since taking out the bullish trend line at the start of this month and also breaking decisively below that key 6900 handle on Thursday. Going forward, this level may turn into resistance, though a clear break above it should be seen as a positive outcome. The UK index is now approaching some technically-important levels, though given the growing selling pressure it remains to be seen whether these levels will hold as support or not; indeed, some bearish speculators may well be looking at the potential breakdown of such levels as an opportunity to add to their positions.
As can be seen on the chart, the 200-day moving average is now in sight at just below 6750. In the past couple of occasions when the FTSE tested this moving average, a sharp rally followed. Will we see a similar reaction this time around? Time will tell. Below the 200-day SMA, we have two Fibonacci levels at 6735 and then at just shy of 6725; these levels correspond with the 127.2% extension of the most recent up move (from point B to C) and the 38.2% retracement of the last major upswing from the October 2014 low (i.e. from point X to A). Given the Fibonacci levels’ close proximity to the 200-day SMA, it could be more accurately stated that the FTSE is testing a key support area between 6725 and 6750. Thus, purely from a technical point of view, a bounce here appears likely. However, if this support area fails to hold then a continuation towards the other Fibonacci levels could get underway later in the week – the most important of these being the 61.8% retracement of the rally from October, around 6475.